Download
1 / 36
360 likes | 468 Views
AIM: What is a circle graph?. OBJECTIVES. Ability to customize a circle graph independently based upon scientific data. DEFINITION: a CIRCLE GRAPH is a diagram which represents varying sections of DATA The DATA VALUES are expressed as a percentage diagramed as a circle.

E N D
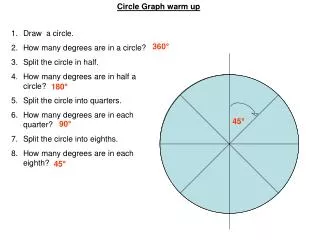
AIM: What is a circle graph? OBJECTIVES Ability to customize a circle graph independently based upon scientific data
DEFINITION: • a CIRCLE GRAPH is a diagram which represents varying sections of DATA • The DATA VALUES are expressed as a percentage • diagramed as a circle. AIM: What is a circle graph?
Example: Who eats the Pizza at Mr. Z’s • How many slice are in a pizza? 8 • What Percentage of the total is 4 slices 50% AIM: What is a circle graph? • What percentage of the total is 2 slices 25% • What percentage of the total is 1 slice? 12.5%
Example: Who eats the Pizza at Mr. Z’s • Mr Z eats 4 slices. What percentage of the total pie is that? 50% • Mrs. Z eats 2 slices what percentage of the total pies is that? AIM: What is a circle graph? 25% • Alex eats one slice. 12.5% • Andie eats one slice. 12.5%
Example: Who eats the Pizza at Mr. Z’s Andie 12.5% Mr. Z 50% AIM: What is a circle graph? Alex 12.5% Mrs. Z 25%
Example: How much Pizza? Jon has 4 slices, Bill has 3, Sue has 1 Person Slice % Jon 4 = 4/8 Bill 3 = 3/8 Sue 1 = 1/8 TOTAL 8 50% 37.5% 12.5% AIM: What is a circle graph?
Example: How much Pizza? Jon has 4 slices, Bill has 3, Sue has 1 Sue 12.5% Jon 50% AIM: What is a circle graph? Bill 37.5%
Tips for Circle Graphs? • Organize your data into a table FIRST! • Figure about how many total sections of the “pie” there must be for your graph AIM: What is a Circle graph?
Tips for Circle Graphs? • Start at the center of the circle and draw your lines outward to the circumference • Try to label each piece of the wedge in the wedge first. Draw a line if it does not fit • Circle graphs need to have percentages! • Don’t forget to Title your graph! AIM: What is a Circle graph?
CLASS EXAMPLE Suppose you watched TV all day. You saw 35 toy commercials, 25 cereal commercials, 25 fast food commercials, and 15 commercials for other products What do you do first? AIM: What is a Circle graph?
Step One: Put your Data in a Table • Number of Commercials • Type of Product Number of Adds • Toys 35 • Breakfast Food 25 • Fast Food 25 • Other products 15 AIM: What is a circle graph?
Step Two: Calculate the total number of TV commercials in your study • 35 + 25 + 25 + 15 = 100 Total Units • 100 Total Commercials in all categories AIM: What is a circle graph?
Step Three: Calculate the percentage of each section to the total number of units • Toys 35/100 • Breakfast Foods 25/100 • Fast Foods 25/100 • Other 15/100 AIM: What is a circle graph? 35% 25% 25% 15%
GRAPH IT! AIM: What is a circle graph? Don't forget your labels and the title!
Kinds of Adds on Children’s TV Shows Fast Food 25% Toys 35% AIM: What is a circle graph? Breakfast Food 25% Other 15%
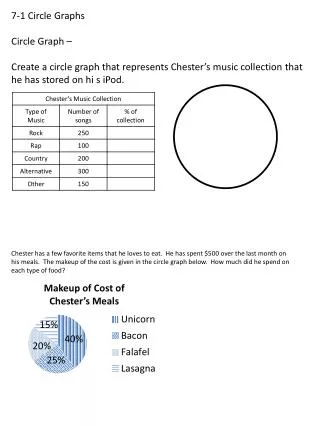
Sports Participation by Sex Total 45 50 30 24 149
Sports Participation by Sex Total 45/149 * 100 = 30% 50/149 * 100 = 34% 30/149 * 100 = 20% 24/149 * 100 = 16% 149
NMS Fundrasing Profit 40 100 100 100 340
NMS Fundrasing Profit 40/340 * 100 = 12% 100/340 * 100 = 29% 100/340 * 100 = 29% 100/340 * 100 = 30% 340
NMS Absences Total 21 23 18 62
NMS Absences Total 21/62 * 100 = 34% 23/62 * 100 = 37% 18/62 * 100 = 29% 62
Class ACTIVITY: Middle School Circle Graph page 70 (next page) AIM: What is a Circle Graph?
Homework: INTERNET QUESTIONS AIM: What is a circle graph?