Download
1 / 21
210 likes | 310 Views
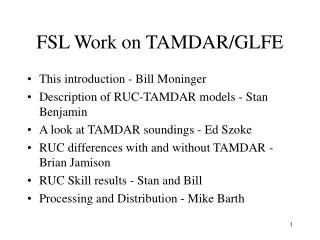
FSL Infrastructure developed for the GLFE (1). Aircraft display (http://amdar.noaa.gov/) shows Wind, T, Td, RH, Turbulence, Icing TAMDAR and non-TAMDAR can be selected Soundings displays available from aircraft display available as separate page

E N D
FSL Infrastructure developed for the GLFE (1) • Aircraft display (http://amdar.noaa.gov/) • shows Wind, T, Td, RH, Turbulence, Icing • TAMDAR and non-TAMDAR can be selected • Soundings displays • available from aircraft display • available as separate page • (http://www-frd.fsl.noaa.gov/soundings/java/)
FSL Infrastructure (2) • MADIS distribution system provides TAMDAR and other aircraft data for • ingest into local models • display on AWIPS • some difficulty displaying humidity with AWIPS soundings has been addressed recently
FSL Infrastructure (3) • Matched real-time RUC models • “dev” doesnot include TAMDAR • “dev2” includes TAMDAR • otherwise dev is identical to dev2 • Stan will discuss this in more detail
FSL Infrastructure (4) • Aircraft-RUC database • stores 1h forecasts from dev, dev2, and operational RUC models interpolated to aircraft data points • Partial output available at • http://amdar.noaa.gov/ruc_acars/ • Statistics by FSL aircraft ID • 7-day summary is sortable in many ways • Recently: information about which obs were rejected in each RUC run • A (highly restricted) plan-view page • restricted because it allows individual airlines to be displayed
Sensor Performance Statistics • TAMDAR (and other aircraft) observations are compared with 20km RUC 1-h forecast • 1h forecast is more independent of the data than the analysis • RUC forecast interpolated in x,y, and log-p to each observation point • Only data passing RUC QC are shown • with the exception of Dash-8’s, which are all rejected by the RUC currently • We don’t consider the RUC perfect, but it is consistent in space and time, so can reveal some observation errors
Airline Comparison, 2 - 17 August 2005, in TAMDAR region, daytime only, p > 500 mb Temperature (°C) Airline N avg mb TRUC Bias RMS AA 20143 782 12.7 0.05 0.8 CN-CRJ 26881 802 12.0 0.16 1.1 CN-D8* 50937 809 12.9 0.97 2.0 DL 5871 730 9.4 0.39 1.2 FX 16447 787 12.8 0.33 1.0 NW 9118 731 8.4 0.28 1.0 SW 9323 822 15.7 -0.02 1.1 TAMDAR 180583 807 13.1 0.08 1.2 UA 26457 709 7.7 0.02 0.8 UP 22698 779 13.0 0.29 0.9 (* all CN-D8’s are currently rejected by RUC)
Airline Comparison, 2 - 17 August 2005, in TAMDAR region, daytime only, p > 500 mb, passing RUC QC Vector Wind Difference (m/s) Airline N avg mb SRUC Avg RMS AA 19986 776 6.2 2.69 3.1 CN-CRJ 27588 802 8.8 2.99 3.5 CN-D8* 40200 810 8.0 4.71 5.5 DL 4072 719 5.8 3.21 3.9 FX 16262 788 6.5 2.74 3.2 NW 9822 731 8.5 2.82 3.3 SW 9364 822 5.9 3.19 3.7 TAMDAR 119069 791 7.7 4.23 4.9 UA 26267 709 7.4 2.65 3.1 UP 22944 775 5.7 2.60 3.0 (* all CN-D8’s are currently rejected)
Airline Comparison, 2 - 17 August 2005, in TAMDAR region, day and night, up and down, p > 500 mb, passing RUC QC Relative Humidity Difference (%RH) Airline N avg mb RHRUC Bias RMS TAMDAR 179768 810 55.9 -0.30 12.0 TAMDAR-up 71106 850 59.0 -1.29 11.1 TAMDAR-dn 78074 854 58.2 0.98 11.5
A Detailed look at TAMDAR compared with other airlines Most of the following plots show: • Data from 1 - 17 Aug 2005 • Differences between ob and dev2 RUC • (ob minus model) • for data passing RUC QC (and not on reject list) • (we reject about 2% of TAMDAR Temperature obs) • (we reject about 10% of TAMDAR Wind and RH obs) • To facilitate comparison with other airlines: • No data between 0300 and 1200 UTC • Only data in the TAMDAR region • lat between 37°N and 49°N • lon between 75°W and 101°W • “Other” is all airlines except • TAMDAR and CN-D8
“Other” data are further south, so sample lower winds below 500 mb.
Wind errors: some are isolated, like this one. AC #7139 measures 54 kt winds at 9882 ft on ascent from MSP. (Caught by RUC QC.)
Wind Errors. Some are grouped. AC#5577 measures 36 - 42 kt winds between 8100 ft and 4100 ft on descent into MSP. (Caught by RUC QC.)
Conclusions (1) • TAMDAR Temperatures are generally good • however, ascents have a warm bias, descents have a cool bias • TAMDAR winds are more troublesome • substantial errors on descent, possibly due to maneuvers • errors on ascent are greater than other fleets • TAMDAR RH bias is small • but ascent/descent dependent • TAMDAR rms RH increases substantially with altitude
Conclusions (2) • The FSL Aircraft-RUC database is an increasingly rich source of information • we now know which obs are rejected/accepted by the RUC, and for what reason • can easily stratify by ascent/descent • can stratify by airline and airframe type • we expect to perform increasingly informative studies using this tool