Download
1 / 35
360 likes | 497 Views
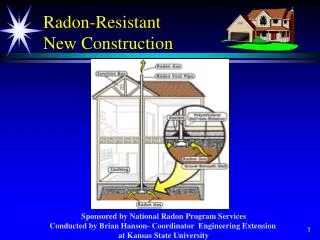
New Construction. EM&V of the Statewide Savings By Design Program Presenter: Matt Brost – matt.brost@rlw.com EM&V of the Statewide California Energy Star New Homes Program Presenter: Bob Kasman – robert.kasman@rlw.com. Studies Performed by:.

E N D
New Construction EM&V of the Statewide Savings By Design ProgramPresenter: Matt Brost – matt.brost@rlw.comEM&V of the Statewide California Energy Star New Homes ProgramPresenter: Bob Kasman – robert.kasman@rlw.com Studies Performed by: MAESTRO/CALMAC Evaluation Showcase ● Pacific Energy Center ● July 26-27, 2006
Non-residential New Construction History Project Goals Methodology 2003 EM&V Results 2004-05 EM&V Plan 2004-05 EM&V Timing Residential New Construction Background 02-03 EM&V Results Evaluation Methodology More Results Conclusions 04-05 EM&V Plan Agenda
History • RLW and Architectural Energy Corporation • NRNC EM&V for SCE and PG&E since 1994 • PY 94 • DOE-2 Simulations, metering and Econometrics • PY 96, 98 and 99 Carry over • DOE-2 Simulations, limited metering and Difference of Differences • 1999-2005 Savings By Design (A.K.A Building Efficiency Assessment) • EM&V becomes statewide study • Net effects by self-report • NP Spillover measured • Industrial projects start showing up in PY 2003 EM&V • 2004-05 introduction of gas measures to EM&V
BEA Project Goals • Gross and net whole building savings • Incented measures • All measures (participant spillover) • Energy and demand (coincident) • Baseline assessment • Program Process • Participant and non-participant DM interviews • New constructions trends • Efficiency, design and construction practices, etc.
BEA Methodology Overview • Stratified participant sample by kWh savings • Based on paid year, not program year • Non-participants selected from FW Dodge • Matched sample 2001-2002 • Representative sample 2003 • Very few in 2004-05 • On-site surveys • DOE-2 Models • Decision Maker Surveys • Measure level net analysis • Informed by self-report • Modeled in DOE-2
2003 Statewide Gross Savings Results • Two gross estimates • All measures • Includes non-incented measures better than Title 24 (Part. spillover) • Measures only • Applies to systems projects
2003 Statewide Net Savings Results • Two net savings estimates • Participant net savings • Gross minus free-ridership • Comprehensive net savings • Gross minus free-ridership plus non-participant spillover
BEA Results Comparison • Commercial • 75-82% Comprehensive net-to-gross • 59-76% Participant net-to-gross • Industrial • 35-59% Net to Gross • No 1999-2001 projects
Commercial Efficiency – 1998 and 2001 Title 24 (2003) Participant and Non-participant Energy Savings as a Percentage of Baseline Consumption – 2001 Title 24 versus 1998 Title 24, Commercial Sites Only (Unweighted)
2003 Commercial Efficiency Combined Participant and Non-participant Energy Savings as a Percentage of Baseline Consumption – Commercial Sites Only
Participant Feedback • Importance of design assistance and analysis • Helps “sell” the measure • Corroborates internal decisions • Introduces new measures and technologies • Incentives very important • Helps measures meet investment criteria • Makes measures easier sell • Insurance against savings uncertainty when considering new measures and technologies • Not likely to get participation without it
2004-05 EM&V • Much of the same • Also, many new aspects • Introduction of gas measures and savings analysis • Much larger more complex projects • Very few non-participants, nearly all participants (n=180) • Large proportion of projects “industrial” • End-use metering and DOE-2 calibrations • PG&E add-on study • More projects and more metering • Load profile tool • All due April 2007
EM&V of the Statewide California 2002-03 Energy Star New Homes Program Robert Kasman robert.kasman@rlw.com (707) 939-8823 x32
Non-residential New Construction History Project Goals Methodology 2003 EM&V Results 2004-05 EM&V Plan 2004-05 EM&V Timing Residential New Construction Background 02-03 EM&V Results Evaluation Methodology More Results Conclusions 04-05 EM&V Plan Agenda
CA Energy Star Homes Program • Statewide program (PG&E, SCE, SDG&E and SCG) • Pays cash incentives to single family and multifamily developers/builders • Started 2002 • Funded by Public Goods Charge (PGC) • Requires minimum 15% compliance margin increase over Title 24
CA Energy Star Homes Program Incentives Compliance margins are relative to Title 24 building code Package D (set of prescriptive measures)
Requirements for Effective Evaluation • A well-conceived program theory and logic model • Complete and accurate program tracking data • Consideration of appropriate baseline data
Single Family Electricity (kWh) Net to Gross Ratios • Statewide NTG > 1! (Yikes) • How can this be?
Single Family Gas (Therms) Net to Gross Ratios • Note statewide NTG is << 1 • Why so different?
Evaluation Methodology – Engineering Analysis • Based on Title 24 compliant energy modeling software • On-site inspections: 110 SF homes, 123 MF structures • Re-simulation of Title 24 energy models when differences found • SF average “as-built” findings used to adjust tracking savings using ratio estimation at end-use level • SF Difference of differences • SF Billing analysis • MF Builder/decision maker surveys for free ridership
Single Family Billing Analysis • No conclusive results. Why? • Baseline study by RMST climate zones not high enough resolution • Behavioral and demographic variation further blur results • Billing data acquisition/quality issues
Multifamily Compliance Margins on MF Inspected Plans (n=123)
Multifamily Results • Number of multifamily structures = 758 • Number of multifamily dwelling units = 7,281 • Annual Net kWh Savings = 93,599 kWh • Annual Net Therms Savings = 233,258 therms • Average Net to Gross = .63 (from surveys) • Average free ridership = 37% • Non-participant spillover not estimated
Conclusions • ESH program resulted in significant energy savings • Both implementers and evaluators based impacts on modeling software – results less conclusive • New Title 24 code expected to have significant impact (beyond free-ridership) on multifamily projects • Evaluation challenges: • Tracking database QC issues (primarily due to many input sources) • Baseline data issues (climate zones, sample sizes)
Conclusions • Most single family homes not built to plan, but average energy savings are realized anyway • Most multifamily projects built as planned, energy savings dominated by water heating • SF free ridership rates dependent upon energy -- negative for electricity, positive for gas • MF not like SF -- wide variation in type, design and energy modeling of multifamily projects… significantly more complex to conduct EM&V analysis • MF high free ridership rates due to loopholes in Title 24. (Loopholes intended to be closed with the October ‘05 code revisions.)
04-05 EM&V Plan • RLW Analytics currently conducting ’04-’05 ESH program evaluation • Includes metering study of both SF and MF new construction yielding actual consumption, not modeled data • Process and non-energy benefit analysis • More comprehensive billing analysis in select climate zones • Data acquisition issues