Download
1 / 13
130 likes | 132 Views
This study examines the abundance gradients in the spiral galaxy M33 using bright planetary nebulae. It explores the use of different methods and techniques to determine elemental abundances and compares the results obtained from giant HII regions and planetary nebulae. The observations were made using the ISIS spectrograph attached to the WHT 4.2m of the ORM in La Palma.

E N D
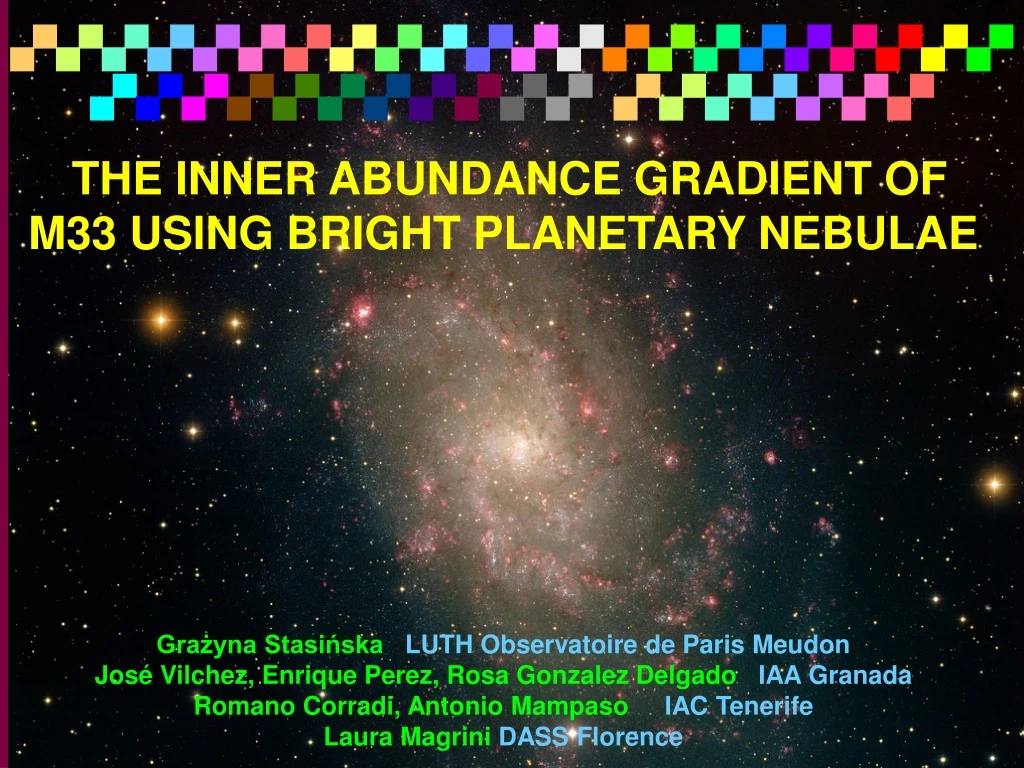
................................. ....... THE INNER ABUNDANCE GRADIENT OF M33 USING BRIGHT PLANETARY NEBULAE Grażyna Stasińska LUTH Observatoire de Paris Meudon José Vilchez, Enrique Perez, Rosa Gonzalez Delgado IAA Granada Romano Corradi, Antonio Mampaso IAC Tenerife Laura Magrini DASS Florence
Giant HII regions start the saga of abundance gradients in M33........................................ .................. ... ... giant HII regions were the first indicators of abundance gradients in spiral galaxies easily observed easily interpreted if Te can be determined eg from [OIII]4363/5007 • ionic abundances from line intensity ratios: • O++/H+ = ([OIII]5007/Hb) / (e[OIII](Te)/eHb(Te)) • elemental abundances • adding observed ions O/H=O+/H+ + O++/H+ + ... • or using icfs (e.g. Ne/O=Ne++/O++) if Te cannot be measured directly (i.e. if only “strong lines” are measured) • abundances derived using “statistical methods”calibrated onphotoionization modelsof HII regions or on observations of GHRs with measured Te
Giant HII regions start the saga of abundance gradients in M33........................................ .................. ... ... O/H combination of results from Vilchez et al 1988 Kwitter & Aller 1981 Smith 1975 N/H
other ways to determine abundance gradients in spiral galaxies........................................ .................. ... ... stellar clusters Ma, Zhou, Chen 2004 not robust abundances determinations probe wide range of ages B supergiants Monteverde et al 1997, 2000 difficult to observe, still few points analysis through complex modelling supernovae Smith et al 1993 not robust abundance determinations AGB stars Cioni ( this conference) calibrated on HII region abundances(Cook et al 1986) or on stellar population evolutionary models(Mouhcine & Lançon 2003) planetary nebulae our work difficult to observe (eg Roth et al 2004) but robust abundance determinations
what is wrong with HII regions?........................................ .................. ... ... in the central parts of spiral galaxies the metallicity is supposedly high although the gradients could also flatten (Smartt et al 2001) or even become inverted (Gorny & Stasińska 2004) at high metallicities metal cooling depresses the electron temperature and the weak [OIII]4363 line is not observed one has to rely on “strong line” methods the derived values of O/H strongly depend on the calibration used (Pindao et al 2002) Observations with Very Large Telescopes cannot help: even if [OIII]4363 is measured the derived O/H will be underestimated since strong Te gradients due to cooling by [OIII] 52, 88m make [OIII]4363/5007 overestimate Te in the emitting zones
the advantage of using extragalactic PNe........................................ .................. ... ... useful spectroscopy can be done only on luminous PNe evolution of PNe in the( L[OIII] vs nH ) and (L[OIII] vs T* diagrams) for different central star masses ____M* = 0.58 M ____M* = 0.60 M ____M* = 0.62 M ____M* = 0.64 M luminous PNe have high nH and high Teff (>100000K) during a large fraction of tlife both factors increase Te with respect to giant HII regions and eliminate the bias in the determination of O/H (Stasińska 2000) Giant HII region high luminosity PN
What is probed by the chemical composition of luminous PNe? ........................................ .................. ... ... • most luminous PNe • have central star masses of ~0.64Mo • are descendent of stars with initial masses of ~3 M • their Ne, Ar, S abundances are expected to be the same as those of the ISM out of which the progenitors were formed about 1 Gyr ago initial-final mass relation • their oxygen abundances might be slightly affected by mixing processes in the progenitors • (if the initial metallicity is smaller than 1/4 solar)
our observations of PNe in M33........................................ .................. ... ... Magrini et al. (2000; 2001)
our observations of PNe in M33........................................ .................. ... ... • planned observations: 10 bright PNe in the inner disk of M33 • due to weather conditions only 4 PNe were observed • Observations were performed using the ISIS spectrograph attached to the WHT4.2m of the ORM in La Palma (Canary Islands) during the night 28 Oct 2003. • The exposures were of 3 hours per spectrum • Both, blue and red arms were • used with a dichroic set to an effective wavelength of 5400 A. • The slit width was set to 1.5 arcsec and the seeing oscillating • between 1.2 to 1.6 arcsec. • The grating R600B was used in the blue arm, centered at 4400 A • yielding a reciprocal dispersion of 0.45 A/pix ; the grating R300R • was used in the red arm centered at 6130 A yielding a dispersion of • 0.84 A/pix.
our spectra........................................ .................. ... ... • detected lines • H Balmer lines, HeI, HeII, [OII]3727, [OIII]4959, 5007, [OIII]4363, [NeIII]3869, [NII]6585, [SII]6716, 6731, [Ar III] 7135 • problems • subtraction of the diffuse emission • stellar absorption lines
very preliminary abundances(do not quote!)........................................ .................. ... ... the abundances of our PNe appear to be well below solar! Te[OIII] O/H Ne/H (x10-6) (x10-6) PN 7a12000-13300 140-184 4.8-3.5 PN 7b14200-17900 66-118 39-73 PN 10a14000-15700 323-176 8.5-11.5 PN 10b<5000-11500 221->5200 30->1300 solar 490 120 • problems with our PNe spectra • subtraction of the diffuse emission • stellar absorption lines
very preliminary abundances(do not quote!)........................................ .................. ... ... the abundances of our PNe appear to be well below solar! is this real ? our PNe sees to indicate the same as the Ne abundances obtained from ISO measurements of giant HII regions byWillner & Nelson-Patel 2002 filled symbols: Ne/H from ISO (no Te dependance, no icf needed) open symbols: O/H (optical data) • problems with our PNe spectra • subtraction of the diffuse emission • stellar absorption lines
Planetary Nebulae as Astronomical ToolsGdańsk (Poland)28 June - 2 July 2005GrażynaStasińska and Ryszard Szczerba (co-chairs) • Planetary Nebulaeas tests of stellar evolution theories • Planetary Nebulaeas tests of stellar nucleosynthesis theories • Planetary Nebulaeas tests of stellar atmosphere models • Planetary Nebulaeas tests of atomic physics • Planetary Nebulae as test of photoionization models • Planetary Nebulaeas tests of radiation hydrodynamics • Planetary Nebulaeand progenitors as sites of cosmic dust formation • Planetary Nebulaeas constraints for models of chemical evolution of galaxies • Planetary Nebulaeto determine the total masses of galaxies • Planetary Nebulaeto detect stellar populations in the intergalactic space • Planetary Nebulaeto test dynamical evolution/build up of galaxies • Planetary Nebulaeas cosmological candles • Planetary Nebulaeas a subject for public outreach