Download
1 / 47
550 likes | 878 Views
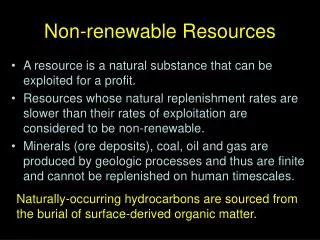
The Economics of Non-Renewable Resources. Ch. 10 and the last few pages of Ch. 2 and supplements. Geological factors and costs of extraction. Although minerals like copper are nonrenewable in an ultimate physical sense, there is actually a long grade continuum.

E N D
The Economics of Non-Renewable Resources Ch. 10 and the last few pages of Ch. 2 and supplements
Geological factors and costs of extraction • Although minerals like copper are nonrenewable in an ultimate physical sense, there is actually a long grade continuum. • Relatively few high-grade deposits, but potential supply increases as grade falls. • Costs of extraction are inversely proportional to the grade • We typically have a good idea about the cutoff grade under present technology, g2. • But the rest of the grade continuum is quite speculative. Grade g2 Quantity of mineral
Introduction • So how much should we use today and how much should we save for the future? • What is the economically efficient rate of geological exploration? • Why does too little recycling occur with non-renewable resources? • We look at what economic theory has to say about these issues • Let’s begin by assuming that we have a known limited supply of a resource, like high-grade copper, that we can use during two time periods – now and in 10 years time. • The world ends in year 11. • We will consider all possible future periods later. • Owners of copper deposits will decide whether to exploit them immediately or hold them for a future period based on an estimate of probable future prices.
Static equilibrium in the current time period • For now, we assume no externalities associated with copper production • The static equilibrium (where only present costs and benefits of copper production and consumption are considered) is Q = 200 and P = 100 • Algebraically, MNB is Pd – Ps • Area under marginal net benefit (MNB) is total surplus: value to consumer minus cost of supply
Balancing present and future periods • We cannot know the MNB of copper in period 2 for sure, but let’s assume MNB in period 2 = MNB period 1 (simplifying assumption) • We do know the fixed quantity of copper to be allocated between the two periods, 250 units. • Because we want to compare two time periods, we must convert future benefits into present values: PV[MNB2] = MNB2/(1+r)n • Suppose real discount rate is 7.25% and n = 10 years, then PV[MNB2] = MNB2/(1.0725)10 = MNB2/2 • Thus PV[MNB2] is a line half the height of undiscounted MNB2
Dynamic equilibrium for two periods • At the intersection of MNB1 and PV[MNB2], the present value of the marginal net benefit of one unit of copper is the same for both periods • 150 units in period 1 and 100 units in period 2 is the economically optimum allocation of copper – maximises the present value of net benefits of copper consumption • Recall in our static equilibrium for period 1, Q1 = 200 • Can be solved algebraically by setting MNB1 = PV[MNB2], • subject to the constraint that Q1 + Q2 = 250. • i.e. change in net benefits in period 1 = change in net benefits in period 2. • 100 – 0.5Q1 = 100 – 0.5Q2 • (1+r)n
Dynamic equilibrium for two periods:Suboptimal intertemporal resource allocation • Compare the dynamic equilibrium with any other allocation, e.g. Q1 = 200, Q2 = 50 • Gain total net benefits of A2 in period 1, but lose A2 + B2 in period 2. Net loss of total net benefits of B2
User costs and resource depletion • If we chose to use only 50 units of copper today, 200 would be left for period 2 – enough to fulfill the maximum demand in that period • If Q1 > 50 units, we begin to cut into amount of copper potentially consumed in period 2. We begin imposing costs on future consumers of copper • These costs are marginaluser costs or simply user costs and represented by PV[MNB2] • Can justify using copper today, so long as user costs are less than benefits of consuming copper today • Marginal user cost at the equilibrium is: • MNB1 = 100 – 0.5(150) = $25
Market for copper in the first period with marginal user costs • Recall, when we didn’t consider period 2 at all, the static equilibrium in period 1 was Q1 = 200 and P1 = $100 • Now add the user cost (just as we have added externality costs to private costs when looking at market failure) • Result is a social cost schedule S’ • New dynamic equilibrium in the first period: Pd = Ps, where Ps has • $25 added to it to reflect the user cost at the equilibrium (represented by dotted schedule) • Pd = 150-0.25Q1 = Ps = 50 + 0.25Q1 • + (50 – 0.25(250 - Q1) • Solve for Q1 = 150, P1 = $112.5 • Note P1>cost of supply = rent
Market for copper in the second period • With first period consumption of 150 units, 100 units will remain for period 2. • We assumed demand in period 2 same as period 1 • So, period 2 price = 150 – 0.25(100) = $125
More on user costs and efficient extraction path • Suppose we expect extraction costs will be higher in period 2 than in period 1 because of the need to extract lower quality grades. • How will this affect MNB in period 2 and therefore user cost in period 1? • MNB2 will decrease, thus user cost in period 1 will decrease • How will this affect extraction level in period 1? • Increase • How will user costs and extraction levels in period 1 change if we expect population growth such that demand in period 2 is greater than in period 1? • User costs will increase and efficient level of extraction in period 1 will decrease.
Resource Rent and the Efficient Extraction Path • Resource rent is the value of the marginal unit of the resource. • The text says rent is price minus marginal costs of production. • This is the same as the MNB (as adopted here). • Efficiency in extraction requires that: • 100 – 0.5Q1 = 100 – 0.5Q2 • (1+r)n • Which can be expressed as Rent2 = (1+r)Rent1 • The optimal extraction profile is the one that yields a rent that rises at the rate of discount, r each year. • r is the rate of return the deposit manager can make on other types of productive assets (i.e. their opportunity cost of capital). • Therefore, efficient resource extraction becomes a matter of maximizing a portfolio of valuable capital assets.
User cost and resource depletion • If user costs are internalized as outlined above, this dynamic equilibrium reflects the needs of the present and future. • The higher future price (compared with the present) will send a signal to produce and use less today, thereby conserving more of the resource for the future. • But, how will user cost be reflected in the market? • One possibility is a resource depletion tax that would shift the supply schedule to the real social cost S’ (like the dotted line four slides back). • Other mechanisms include direct government control of resource exploitation and maintaining stockpiles.
User cost and resource depletion • In some cases, the market may not need government intervention to internalize user costs. • For example, if the time until resource depletion is expected to be relatively short, private owners will anticipate the second period higher prices (resulting from resource scarcity) and hold back supply in the current period. • Thus, market processes could cause a leftward and upward shift of the current period supply curve to S’ without imposing a tax • The price of copper, at any particular time t, can be represented by the equation: Pt = MUCt + MECt • Where • MUC refers to Marginal User Cost, and • MEC refers to Marginal Extraction Cost
Marginal User Cost and Marginal Extraction Cost • With this equation it is possible to predict the changes in the price of nonrenewable resources by predicting changes in the marginal extraction cost and the marginal user cost. • Consider the rise in MUC when Iraqi forces invaded Kuwait in early August 1990. • Fear about potential changes in production levels in Kuwait drove up the opportunity cost (MUC) of using a barrel of oil at that time. • Prices rose dramatically but fell again when US forces established dominance and removed concerns about falling production.
Marginal User Cost and Marginal Extraction Cost • Two important points: • The existence of MUC means that price will always be different from MEC. MUC is a form of scarcity rent (not monopoly profit). • In order for an owner of a nonrenewable resource to be indifferent as to the period in which he or she sells, the present value of the MUC must be the same in all periods • This means that, ceteris paribus, MUC of an exhaustible resource will increase with the discount rate. • Let’s see why.
Hotelling’s rule and discounting • Our simple two period model highlighted the importance of the discount rate in determining the optimal allocation of copper • At different discount rates, the optimal allocation of copper between the two periods will vary substantially • At a zero discount rate, we equally value present and future consumption, but value current consumption more highly when the discount rate is greater than zero
Hotelling’s rule and discounting • Now we consider an infinite number of time periods, not two • The principle involved is Hotelling’s rule: in equilibrium, the resource net price or MNB (defined as the price minus extraction costs) must rise at a rate equal to the discount rate. • The owner’s profit on the marginal copper unit extracted = net price. • In deciding how much copper to produce each period, the owner will compare the net price available today with a possible higher future net price. • If the current net price plus interest that could be earned by investing elsewhere the proceeds of extracting today exceeds the probable future net price, then the owner will extract more today rather than holding reserves for the future. • Conversely, if the future net price is higher than the price today plus interest, it will be more profitable to hold stock and sell at a future date.
Hotelling’s rule and discounting • That is, if PV[MNBt] > PV[MNBt+1], then extract more today. This will drive down price in period t and drive up the price in period t+1. • If PV[MNBt] < PV[MNBt+1], then extract less today. This will drive up the price in period t and drive down the price in period t+1. • Efficient level of extraction in any period will be where PV[MNBt] = PV[MNBt+1] for all time periods until the resource is exhausted.
Hotelling’s rule and discounting • If all owners follow this logic, the quantity of copper supplied today will increase until today’s copper price falls low enough to encourage resource owners to conserve, hoping for a better future price. • At this point Hotelling’s rule will hold: The expectations of future price increases will exactly follow an exponential curve: P1(1+r)n, where P1 = today’s net price (MNB) r = discount rate n = number of years from the present
Time e is where future value of rents are maximised, but because of discounting, the present value of those rents may not be high. • We will be willing to extract some of the resource in period e-1, so long as: PV[MNBe-1] >= PV [MNBe] • And so-on back to the present time period, such that we are indifferent between extracting the marginal unit of the resource today or some other time period in the future Hotelling’s rule and discounting • How can this price path be computed? • We need to know the ‘choke price’ and the stock (quantity) of the non-renewable resource • The choke price is the price at which some super abundant substitute becomes available to replace the non-renewable resource in question, e.g. solar energy for fossil fuels • In time period e, when the stock is exhausted, price will be Pe and net benefit will be MNBe D Price of non-renewable resource Choke price (Pe) MNBe Marginal costs of production of non-renewable resource (C) Static equilibrium quantity in time period 1 Qe Quantity of non-renewable resource extracted per period
Competitive price path (top) and extraction path (bottom) Marginal costs of production of non-renewable resource (C) Time Price $ Pe Quantity of non-renewable resource extracted Price path MNBe MNBe-1 e-1 e Time e
Hotelling’s rule and discounting • Under market conditions, a nonrenwable resource will be used at an ‘optimal’ rate and this will be faster at higher discount rates. • Under this theory, it is optimal to completely exhaust the copper resource. • Perhaps we want to consider sustainable development options? • This theory excludes environmental externalities. Internalizing externalities in the copper market would raise market prices and reduce consumption of copper in each period. • In addition, a market for recycled copper is likely to develop, providing a new source of supply not considered in our basic analysis so far.
Summary of computer lab • Please keep and refer to your computer lab notes • If the non-renewable resource industry is competitive, with complete futures markets for the resource, qt, then net price will rise at the rate of discount. • This will be socially optimal if the social discount rate is equal to the industry’s rate of discount. • A monopolist will extract the resource to maximize present value of marginal revenues to earn monopoly profits. • The price under a monopoly will start at a higher level, but rise at a slower rate than in a competitive industry (Marginal revenue is rising at r, not market price). • Resource will last longer if extracted by a monopolist, but this is not out of a conservation ethic, simply to maximise present value of monopoly profits.
Effect of discount rate on price path (and extraction path) r high r low Marginal costs of production of non-renewable resource (C) Price $ Pe Time T
Extraction path and price path for base case competitive industry (red) and for competitive industry when reserves of non-renewable resource are higher than expected (blue) Higher reserves
Fall in Demand • Base case (red) and fall in demand for non-renewable resource (blue) • Fall in demand means quantity demanded at each and every price falls. This makes the non-renewable resource relatively less scarce and market prices fall to reflect this (qt and pt fall in early periods) Time to exhaustion increases because less consumed each period Choke price has decreased because WTP has fallen
Tax on extraction of non-renewable resource increases the market price in early periods and decreases quantity extracted in early periods • Time to exhaustion of stock increases and market price rises at less than r% • The net of tax price that firms receive is rising at r% Tax on extraction
Left: extraction path for competitive industry (blue) versus monopoly (red) • Right: price path of competitive industry (blue) versus monopoly (red) Marginal revenue rising at r%, not market price
Why don’t we see smooth and increasing price paths in reality? • Real mineral prices in 2000 less than in the 1960s. • Technological innovations decreasing costs of exploration, development, extraction, transportation and processing. • When comparing present and projected use of many non-renewable resources with expected future availabilities, market participants see no particular reason why prices should go up in any relevant human-scale time frame. • Surging demand from developing countries is a major factor in the recent upswing in mineral prices (since the early 2000s), but prices fell again with the ongoing global financial crisis that began in earnest in 2008. • Mineral prices have been increasing again as we come out of the global financial crisis.
Why don’t we see smooth and increasing price paths in reality? • Changes in opportunity cost of capital (r), stock (Rt) and demand do occur fairly regularly in commodity markets • Figure below shows hypothetical shifts in the price path over time with changes in r, Rt and demand. Price Time
Market failure in the extraction and conversion of mineral and fossil fuel resources • The extraction of non-renewable resources often creates waste. • Mechanical and chemical processes are often used in refining non-renewable resources and converting them into marketable products, and the waste from these processes can be hazardous to plants and animals, and can contaminate ground water, surface water and air. • The consumption of goods and services manufactured from non-renewable resources also generates wastes.
Market failure in the extraction and conversion of mineral and fossil fuel resources • Environmental externalities result from waste that is generated and the disruption of the landscape that occurs as a result of mining and refining activities. • In the context of price and extraction paths, internalizing these externalities would lead to higher resource prices now and lower consumption now, delaying the time to exhaustion of the stock • A few points worth emphasizing: • Since most of the convenient opportunities for mining have already been exhausted, many potential new mines are located in wilderness areas or other areas that have unique (high) environmental values. • The opportunity cost of losing these environmental resources is usually not factored into the price of the non-renewable resource
Market failure in the extraction and conversion of mineral and fossil fuel resources 2. The benefits of preserving the environmental resource are primarily public good benefits and are often not considered in land use decisions, since the landowner cannot capture these benefits. 3. The existence of potential irreversible damage as a consequence of mining suggests a need to be cautious – we cannot recreate a wilderness once it is destroyed by, e.g. by mountain-top removal mining processes. 4. Since development of any particular mine is an " either / or" decision and not a marginal decision, marketable permits and taxes are not appropriate tools when an individual mine is of concern (although they are useful for modifying overall production and consumption). • A benefit-cost analysis of societal benefits and societal costs should be conducted. • Other decision-making criteria which consider equity, sustainability, environmental justice and ecological risk should also be examined.
Inappropriate government intervention • In the USA, a depletion allowance, which allows the firms to depreciate their mineral deposits in the same way a manufacturing firm is allowed to depreciate capital items, results in a lower marginal private cost associated with production and a higher level of mining activity than would occur otherwise. • This increases the disparity between private and social costs associated with mining. MSC P MPC (before depletion allowance) MPC (after depletion allowance) MSB = demand q* q1 q2 Q
Inappropriate government intervention • Another concern in the USA is the 1872 Mining Law (still in effect), which regulates prospecting and production of private minerals on public lands. • Law allows free access of private prospectors onto public lands and a process for filing claims on land found to contain economically significant mineral deposits. • If the claim is developed, the prospector can have the claim converted into private ownership at low cost. • For a long time, critics of this law have tried (unsuccessfully) to raise the prices companies have to pay for their claim and to levy a federal royalty on minerals extracted.
Environmental legacies of mining • Many old mines create serious ongoing environmental problems such as contamination of surface and ground waters, underground fires and exposure of humans and ecosystems to toxic substances. • Policy makers seeking to deal with mine closure and resulting environmental legacies face two problems. 1. The owners of the mines may have disappeared or gone out of business and there is no one to hold responsible for future damages. 2. The second is the difficulty in creating a policy which gives current owners an incentive to properly close their mine. - The “temporal separation” between current operations and distant future shut down makes it difficult to design an appropriate incentive system. • Options include performance bonding systems, maintenance funds for periodic maintenance of the mined site and requiring mine owners to purchase insurance against future environmental damage
Why does too little recycling occur? • An increase in recycling would mean we would use fewer ‘virgin’ minerals, have less mining disturbing the environment, use less energy and have less waste to dispose. • e.g. recycling aluminum saves 95% of the energy that is needed to make new aluminum from ore. • Inefficient level of recycling because: 1. Social cost of extracting and (after consumption) disposing materials is not reflected in either the market price of products nor the price of waste disposal – makes recycling less profitable. 2. Inertia built into our economic system makes it difficult for recycling to become established.
Social cost of extracting and (after consumption) disposing materials not internalized • We are familiar with air, water, habitat destruction and other social costs of extracting and producing ‘virgin’ materials, which are not reflected in market price • Disposal costs can also be substantial: • Landfills reduce aesthetic values of surrounding land; and • Landfills can generate environmental harm – offsite movement of waste in ground and surface water • In addition to environmental externalities, market failure with waste disposal has arisen because of inappropriate government-regulated waste disposal activity • Governments providing waste disposal services have not priced disposal fees at its marginal social cost.
Social cost of extracting and (after consumption) disposing materials not internalized • Government waste disposal pricing problems: • Environmental costs associated with waste disposal are not incorporated into the price; • Scarcity value of landfill space is not incorporated into the price. Relatively few sites are physically suited as landfill sites; and • Price is often based on average cost rather than marginal cost. Consumers receive monthly bills that are independent of the amount of waste they generate. MC to consumer of throwing away one more unit of waste is negligible even when the cost to society is not. • Because social costs of extracting ‘virgin’ materials and disposing waste are not built into the price of goods or the cost of disposing them, marginal private costs of using and then disposing goods are lower than the social costs.
Inertia built into our economic system makes it difficult for recycling to become established • In order for the cost of recycling to be relatively low (and compete with ‘virgin’ materials), an extensive amount of recycling must take place to achieve economies of scale. • However, an extensive amount of recycling will not take place without a lowering of the cost of recycling. • e.g. Paper recycling • Recycling of paper requires paper mills locating near large urban areas, not rural forested areas • Recycling of paper also requires trash collection companies to develop sorting mechanisms and storage areas for recycled materials • These investments are expensive and risky for private firms • Private costs of recycling are higher than the private costs of using and disposing ‘virgin’ materials. • But social costs of recycling are lower than the social costs of using and disposing ‘virgin’ materials.
Why does too little recycling occur? • The result is an economically inefficient low level of recycling • If marginal private cost of consuming ‘virgin’ materials and disposing them (MCp) < marginal social cost consuming ‘virgin’ materials and disposing them (MCs), and the marginal social costs (= private costs) of recycling (MCR) are as illustrated, then the market level of recycling will be inefficient • DWL = abc c b a
Corrective policies • Command and control policies • Government could require a certain percentage of recycled materials in goods in order to generate quantities demanded that will allow economies of scale in recycling. • Subsidization policies • In much the same way that governments sometimes subsidize the establishment of new industries to initially protect them from international competition until they can achieve economies of scale, government could subsidize recycling industries to compete with ‘virgin’ industries. • Government could also perform or encourage private investment in research and development of recycling technologies. • The effect of both approaches is to lower the marginal costs of recycling.
Corrective policies • Tax policies • Tax ‘virgin’ materials to internalize social costs of extraction. • Many countries in Europe tax ‘virgin’ oil and use the resulting income to subsidize the oil recycling industry. • Many countries in Europe recycle about 65% of waste oil. The USA recycles 15%. MCP2
Corrective policies • In the 1980s, the state of Oregon used tax credits to subsidize the establishment of 163 recycling projects • Paper companies used these credits to increase their recycling capacity and now Oregon recycles 65% of its newspaper – twice the national average • The implementation of a federal level packaging tax, in order to reduce the quantity of waste generated in the packaging of goods, would provide manufacturers with an incentive to reduce materials used. • A local or state level tax would probably result in firms choosing to locate in areas without the tax. • In addition, a differential tax system could be developed based on the ability to recycle the packaging material. • This type of tax is a second best alternative compared with reflecting the marginal social cost in resource allocation decisions.
Corrective policies • A deposit-refund system on heavy metals would allow for the removal of these materials from the waste stream for separate handling to meet special requirements for recycling or disposal. • At the state and local level the single most important action would be to develop a system for financing the collection and disposal of solid waste that incorporates the full social cost of waste into the price of collection and disposal. • While voters may resist higher disposal fees, a policy of education and gradual rises in fees may make the rise in price more palatable. • Because sorting recyclables at the household level is more cost efficient, many communities have designed their recycling programs to take advantage of this fact. • By separating yard waste and generating mulch material, many communities have turned a waste item into an economic product.