Download
1 / 1
20 likes | 153 Views
Soil Test Laboratory Division of Regulatory Services University of Kentucky. Revisiting Double Buffer Methods for Lime Requirement Determination. F.J. Sikora. Yuan DB Method (data from Yuan, 1974). 0.25 M IS, 1:10 soil:soln. pH buffer capacity of soil from SMP DB method. water.

E N D
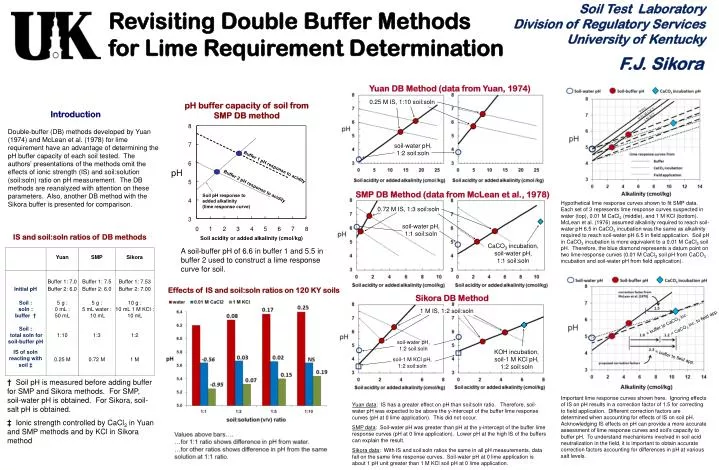
Soil Test Laboratory Division of Regulatory Services University of Kentucky Revisiting Double Buffer Methods for Lime Requirement Determination F.J. Sikora Yuan DB Method (data from Yuan, 1974) 0.25 M IS, 1:10 soil:soln pH buffer capacity of soil from SMP DB method water Introduction 0.01 M CaCl2 1 M KCl Double-buffer (DB) methods developed by Yuan (1974) and McLean et al. (1978) for lime requirement have an advantage of determining the pH buffer capacity of each soil tested. The authors’ presentations of the methods omit the effects of ionic strength (IS) and soil:solution (soil:soln) ratio on pH measurement. The DB methods are reanalyzed with attention on these parameters. Also, another DB method with the Sikora buffer is presented for comparison. soil-water pH, 1:2 soil:soln Buffer 1 pH response to acidity Buffer 2 pH response to acidity SMP DB Method (data from McLean et al., 1978) Soil pH response to added alkalinity (lime response curve) Hypothetical lime response curves shown to fit SMP data. Each set of 3 represents lime response curves suspected in water (top), 0.01 M CaCl2 (middle), and 1 M KCl (bottom). McLean et al. (1976) assumed alkalinity required to reach soil-water pH 6.5 in CaCO3 incubation was the same as alkalinity required to reach soil-water pH 6.5 in field application. Soil pH in CaCO3 incubation is more equivalent to a 0.01 M CaCl2 soil pH. Therefore, the blue diamond represents a datum point on two lime-response curves (0.01 M CaCl2 soil pH from CaCO3 incubation and soil-water pH from field application). 0.72 M IS, 1:3 soil:soln soil-water pH, 1:1 soil:soln IS and soil:soln ratios of DB methods Soil acidity or added alkalinity (cmol/kg) CaCO3 incubation, soil-water pH, 1:1 soil:soln A soil-buffer pH of 6.6 in buffer 1 and 5.5 in buffer 2 used to construct a lime response curve for soil. Effects of IS and soil:soln ratios on 120 KY soils Sikora DB Method 1 M IS, 1:2 soil:soln = CaCO3 inc. to field app. = buffer to CaCO3 inc. soil-water pH, 1:2 soil:soln KOH incubation, soil-1 M KCl pH, 1:2 soil:soln = buffer to field app. soil-1 M KCl pH, 1:2 soil:soln † Soil pH is measured before adding buffer for SMP and Sikora methods. For SMP, soil-water pH is obtained. For Sikora, soil-salt pH is obtained. Important lime response curves shown here. Ignoring effects of IS on pH results in a correction factor of 1.5 for correcting to field application. Different correction factors are determined when accounting for effects of IS on soil pH. Acknowledging IS effects on pH can provide a more accurate assessment of lime response curves and soil’s capacity to buffer pH. To understand mechanisms involved in soil acid neutralization in the field, it is important to obtain accurate correction factors accounting for differences in pH at various salt levels. Yuan data: IS has a greater effect on pH than soil:soln ratio. Therefore, soil-water pH was expected to be above the y-intercept of the buffer lime response curves (pH at 0 lime application). This did not occur. SMP data: Soil-water pH was greater than pH at the y-intercept of the buffer lime response curves (pH at 0 lime application). Lower pH at the high IS of the buffers can explain the result. Sikora data: With IS and soil:soln ratios the same in all pH measurements, data fall on the same lime response curves. Soil-water pH at 0 lime application is about 1 pH unit greater than 1 M KCl soil pH at 0 lime application. ‡ Ionic strength controlled by CaCl2 in Yuan and SMP methods and by KCl in Sikora method