Download
1 / 13
130 likes | 563 Views
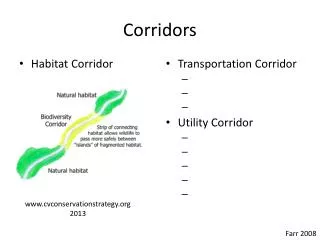
Examining Transportation Corridors with Environmental Data. Strategies for Conducting an Environmental Analysis using the CommunityViz Platform. Environmental Suitability Analysis. Project Introduction Purpose Review current environmental and resource data

E N D
Examining Transportation Corridors with Environmental Data Strategies for Conducting an Environmental Analysis using the CommunityViz Platform
Environmental Suitability Analysis Project Introduction • Purpose • Review current environmental and resource data • Identify areas that are more or less suitable for development (transportation projects) • Overview of the Utility of CommunityViz • Select data layers • Assign weights to signify relative importance • Identify conflict points and what features cause conflict
Conducting an analysis using CommunityViz Environmental Suitability Analysis
How the Environmental Data were Analysed Environmental Suitability Analysis
Thousands of cells that are a quarter mile in length/width Counts the number of point features within a cell and/or the percentage of the cell overlapped by polygon features Weighted score calculated based on Assumption value x data count How the Environmental Data were Analysed Environmental Suitability Analysis
Environmental Groupings: Comparison within Groups Comparison across Groups Priorities
Sensitivity Thresholds Weighted Score > 50
Sensitivity Thresholds Weighted Score > 35
Sensitivity Thresholds Weighted Score > 20
Sensitivity Thresholds Weighted Score > 10
Distilled lots of environmental data into useable information Lessons learned: Data quality and availability (some data were not shared) Difficult to distinguish importance among the environmental elements Everything is important to everyone Prioritized environmental elements Provided an iterative process and evaluation in meeting Included in CIM 2040 corridor write ups Incorporate into performance-based planning (2016) Could assist with the NEPA process Documentation and public involvement are necessary Integration and Future Steps