Download
1 / 15
160 likes | 316 Views
Learn how to perform polynomial, multiple linear, and nonlinear regression in MATLAB. Understand general linear least-squares and optimization techniques for regression modeling. Get insights on error minimization, coefficients determination, and best fit measures calculation.

E N D
General Linear Least-Squares and Nonlinear Regression Berlin Chen Department of Computer Science & Information Engineering National Taiwan Normal University Reference: 1. Applied Numerical Methods with MATLAB for Engineers, Chapter 15 & Teaching material
Chapter Objectives • Knowing how to implement polynomial regression • Knowing how to implement multiple linear regression • Understanding the formulation of the general linear least-squares model • Understanding how the general linear least-squares model can be solved with MATLAB using either the normal equations or left division • Understanding how to implement nonlinear regression with optimization techniques
Polynomial Regression • The least-squares procedure from Chapter 14 can be readily extended to fit data to a higher-order polynomial. Again, the idea is to minimize the sum of the squares of the estimate residuals • The figure shows the same data fit with: • A first order polynomial • A second order polynomial
Process and Measures of Fit • For a second order polynomial, the best fit would mean minimizing: • In general, for an mth order polynomial, this would mean minimizing : • The standard error for fitting an mth order polynomial to n data points is:because the mth order polynomial has (m+1) coefficients • The coefficient of determination r2 is still found using:
Polynomial Regression: An Example • Second Order Polynomial
Multiple Linear Regression (1/2) • Another useful extension of linear regression is the case where y is a linear function of two or more independent variables: • Again, the best fit is obtained by minimizing the sum of the squares of the estimate residuals: For two-dimensional case, the regression “line” becomes a “plane”
Multiple Linear Regression: An Example Example 15.2
General Linear Least Squares • Linear, polynomial, and multiple linear regression all belong to the general linear least-squares model: • where z0, z1, …, zm are a set of m+1 basis functionsand e is the error of the fit • The basis functions can be any function data but cannot contain any of the coefficients a0, a1, etc. • E.g., • However, the following simple-looking model is truly “nonlinear”
Solving General Linear Least Squares Coefficients (1/2) • The equation:can be re-written for each data point as a matrix equation:where {y} contains the dependent data, {a} contains the coefficients of the equation, {e} contains the error at each point, and [Z] is: • with zji representing the the value of the j th basis function calculated at the I th point
Solving General Linear Least Squares Coefficients (2/2) • Generally, [Z] is not a square matrix, so simple inversion cannot be used to solve for {a}. Instead the sum of the squares of the estimate residuals is minimized: • The outcome of this minimization process is the normal equations that can expressed concisely in a matrix form as:
MATLAB Example • Given x and y data in columns, solve for the coefficients of the best fit line for y=a0+a1x+a2x2Z = [ones(size(x) x x.^2] a = (Z’*Z)\(Z’*y) • Note also that MATLAB’s left-divide will automatically include the [Z]T terms if the matrix is not square, soa = Z\ywould work as well • To calculate measures of fit:St = sum((y-mean(y)).^2) Sr = sum((y-Z*a).^2) r2 = 1-Sr/St syx = sqrt(Sr/(length(x)-length(a))) coefficient of determination standard error
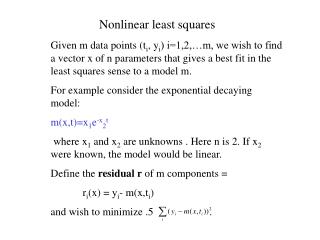
Nonlinear Regression • As seen in the previous chapter, not all fits are linear equations of coefficients and basis functions, e.g., • One method to handle this is to transform the variables and solve for the best fit of the transformed variables. There are two problems with this method • Not all equations can be transformed easily or at all • The best fit line represents the best fit for the transformed variables, not the original variables • Another method is to perform nonlinear regression to directly determine the least-squares fit, e.g., • Using the MATLAB fminsearch function
Nonlinear Regression in MATLAB • To perform nonlinear regression in MATLAB, write a function that returns the sum of the squares of the estimate residuals for a fit and then use MATLAB’s fminsearch function to find the values of the coefficients where a minimum occurs • The arguments to the function to compute Sr should be the coefficients, the independent variables, and the dependent variables
Nonlinear Regression in MATLAB Example • Given dependent force data F for independent velocity data v, determine the coefficients for the fit: • First - write a function called fSSR.m containing the following:function f = fSSR(a, xm, ym) yp = a(1)*xm.^a(2); f = sum((ym-yp).^2); • Then, use fminsearch in the command window to obtain the values of a that minimize fSSR:a = fminsearch(@fSSR, [1, 1], [], v, F)where [1, 1] is an initial guess for the [a0, a1] vector, [] is a placeholder for the options