Download
1 / 23
230 likes | 391 Views
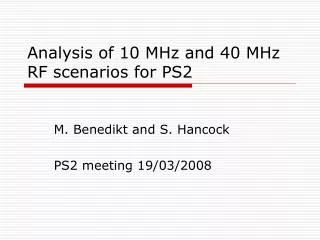
Material characterization for the 18 MHz to 40 MHz sweep-tuneable RF system. Christine Vollinger, Erk Jensen. Measurement support by Fritz Caspers. RF tuning cavity with magnetic bias. E xample for parallel bias (from Gardner, 1991). E xample for perpendicular bias (from Friedrichs , 1991).

E N D
Material characterization for the 18 MHz to 40 MHzsweep-tuneable RF system Christine Vollinger, Erk Jensen Measurement support by Fritz Caspers
RF tuning cavity with magnetic bias Example for parallel bias (from Gardner, 1991) Example for perpendicular bias (from Friedrichs, 1991)
From Talk of Erk in PS2 Review: Parallel plus perpendicular biasing possible? • Smythe suggested in 1983 to use • transverse bias to get into saturation (lower losses) • add’l. parallel bias for tuning (less bias). • Could this work? (I’d like to try!)
Leads to two primary goals: Characterization of ferrite samples with different saturation and line widths under different bias conditions in the required f-range. (This required a dedicated test set-up, since supplier data does not exist – PART 1). Verification of Smythe’s claims (PART 2). First requirement for an f-range of 18-40 MHz is a -range of approx. 5 (since f 1 / Sqrt[] ). Ratio of maximum to minimum f is given by Sqrt[max/ min]; max is the value at minimum bias field.
Measurement Set-up • Problematic: samples are available in sizes 1” x 1” (or smaller); • Small sample size led to strip-line set-up on ferrite; • 1-port frequency swept measurement with NWA chosen to obtain s11. From s11, the DUT impedance is determined and the µ can be calculated; • Measurement taken with magnetic bias field applied perpendicular to signal propagation; • Carries the assumption that the magnetic RF-field left/right of the strip-line can be neglected (there the bias field would be parallel). Hbias Ferrite Strip-line Coaxial connection
μ’ for Material #1 (Y36) μ’-ratio: μ’(20 MHz,145 G)/μ’(40 MHz, 1005 G)=11.1 μ’-ratio: μ’(20 MHz,300 G)/μ’(40 MHz, 1005 G)=4.0
μ’’ for Material #1 (Y36) μ’’-values: μ’’(20 MHz,145 G)= 6.3 μ’’(20 MHz,300 G)= 0.2 μ’’(40 MHz,1005 G)= 0.074
μ’ for Material #2 (G300) μ’-ratio: μ’(20 MHz,145 G)/μ’(40 MHz, 1005 G)=9.0 μ’-ratio: μ’(20 MHz,300 G)/μ’(40 MHz, 1005 G)=2.8
μ’’ for Material #2 (G300) μ’’-values: μ’’(20 MHz,145 G)= 10.1 μ’’(20 MHz,300 G)= 0.12 μ’’(40 MHz,1005 G)= 0.076
μ’ for Material #3 (G810) μ’-ratio: μ’(20 MHz,153 G)/μ’(40 MHz, 1008 G)= 8.5 μ’-ratio: μ’(20 MHz,558 G)/μ’(40 MHz, 1008 G)= 5.8
μ’’ for Material #3 (G810) μ’’-values: μ’’(20 MHz,153 G)= 11.9 μ’’(20 MHz,558 G)= 1.2 μ’’(40 MHz,1008 G)= 0.03
μ’ for Material #4 (RG3) μ’-ratio: μ’(20 MHz,145 G)/μ’(40 MHz, 1004 G)= 12.5 μ’-ratio: μ’(20 MHz,349 G)/μ’(40 MHz, 1004 G)= 3.14
μ’’ for Material #4 (RG3) μ’’-values: μ’’(20 MHz,145 G)= 17.01 μ’’(20 MHz,349 G)= 0.1 μ’’(40 MHz,1004 G)= 0.05
Summary (1/3) • Four ferrite samples have been ordered from industry and measured in an external magnetic bias field. This allowed the determination of their available -range and the corresponding values of ’ as a function of frequency and Bias-field. • Requirement for an f-range of 2.2 from 18-40 MHz is a ’-ratio of approx. 5.
Summary (2/3) • Measurement set-up is found that appears robust and stable (1-port-measurement with NWA). • More ferrite samples from different suppliers are already ordered for measurement. • Next step will be to investigate potential non-linearity of the materials, if exposed to moderate power (IP3 measurement).
Leads to two primary goals: Characterization of ferrite samples with different saturation and line widths under different bias conditions in the required f-range. (This required a dedicated test set-up, since supplier data does not exist – PART 1). Verification of Smythe’s claims (PART 2).
Verification of Smythe’s Claims (PART 2) • Smythe suggested in 1983 to use • transverse bias to get close to saturation (reduces losses) • additional parallel bias for tuning (less bias required for same μ-range).
Measurement Set-up Htune Happlied Hbias Happlied
μ’ for Material #2 (G300) in 2-Directional Magnetic Bias Change of 55 G (parallel) with 200 G perpendicular -> μ’-ratio > 6 μ’-ratio with Hperp=200G: μ’(20 MHz,HparBias=18 G)/μ’(40 MHz, HparBias=200 G)= 6.4
μ’’ for Material #2 (G300) in 2-Directional Magnetic Bias μ’’-values with Hperp=200G : μ’’(20 MHz, Hpar=18 G) = 1.23 μ’’(20 MHz, Hpar=73 G)= 0.106 μ’’(40 MHz, Hpar=200 G)= 0.105
Contour-plots “Smythe” and G300 Material Plot of Smythe Measured Data RF field direction Hpar/4Ms Hperp/4Ms
Summary (3/3) • The idea of Smythe to use a 2-directional magnetic bias field appeared in 1983, but (to my knowledge) has never been used or further investigated. • Smythe had no measurement data to support his claims. • From the measurement done on the G300 sample, it appears as if the method is promising and could work; we will continue further tests with other samples and higher parallel bias fields.
I would like to thank Fritz Caspers for his strong and unfailing support with all kind of measurement problems!