Download
1 / 11
110 likes | 231 Views
FAILURE MODE &. Analytical technique focused at problem prevention through. EFFECTS ANALYSIS. identification of potential problems. The FMEA is a proactive tool that. (FMEA). is used pragmatically to identify potential failures and their effects, to.

E N D
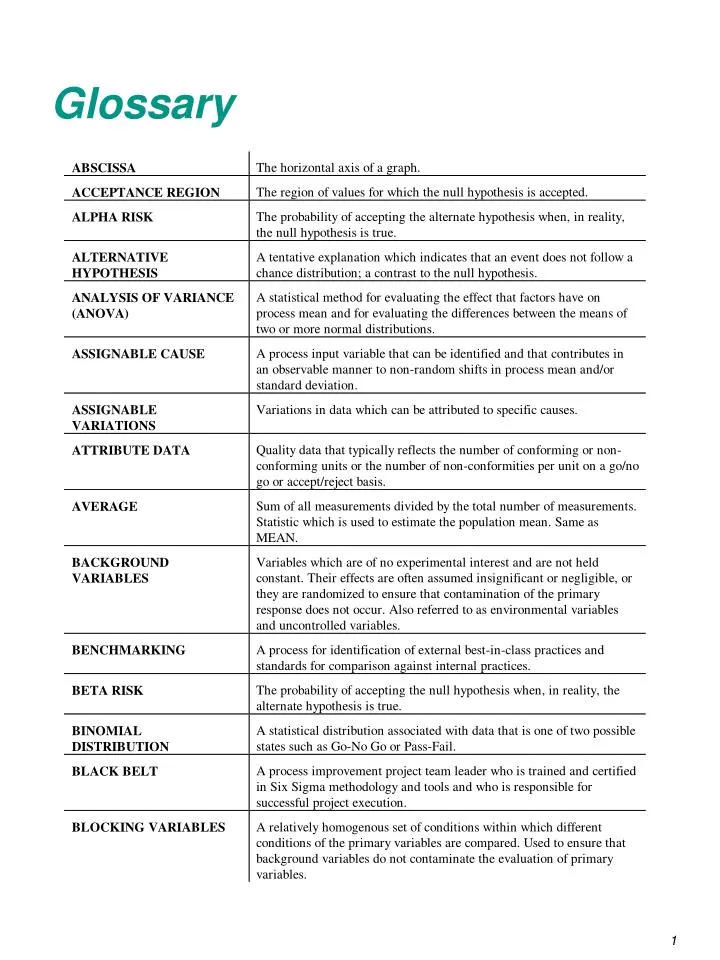
FAILURE MODE & Analytical technique focused at problem prevention through EFFECTS ANALYSIS identification of potential problems. The FMEA is a proactive tool that (FMEA) is used pragmatically to identify potential failures and their effects, to numerically rate the combined risk associated with severity, probability of occurrence and detectability, and to document appropriate plans for prevention. FMEAs can be applied to system, application, and product design and to manufacturing and non-manufacturing processes (i.e., services and transactional processes). FIRST TIME YIELD Yield that occurs in any process step prior to any rework that may be required to overcome process shortcomings. FIXED EFFECTS MODEL An experimental model where treatments are specifically selected by the researcher. Conclusions only apply to the factor levels considered in the analysis. Inferences are restricted to the experimental levels. FLUCTUATIONS Variances in data which are caused by a large number of minute variations or differences. FREQUENCY The pattern or shape formed by the group of measurements in a DISTRIBUTION distribution based on frequency of occurrence. GAGE ACCURACY The average difference observed between a gage under evaluation and a master gage when measuring the same parts over multiple readings. GAGE LINEARITY A measure of gage accuracy variation when evaluated over the expected operating range. GAGE REPEATABILITY A measure of the variation observed when a single operator uses a gage to measure a group of randomly ordered (but identifiable) parts on a repetitive basis. GAGE REPRODUCIBILITY A measure of average variation observed between operations when multiple operators use the same gage to measure a group of randomly ordered (but identifiable) parts on a repetitive basis. GAGE STABILITY A measure of variation observed when a gage is used to measure the same master over an extended period of time. GREEN BELT Six Sigma role similar in function to Black Belt, but length of training and project scope are reduced. HISTOGRAM Vertical display of a population distribution in terms of frequencies; a formal method of plotting a frequency distribution. HOMOGENEITY OF The variances of the data groups being contrasted are equal (as defined VARIANCE by a statistical test of significant difference).
VARIATION Any quantifiable difference between individual measurements; such differences can be classified as being due to common causes (random) or special causes ( assignable). VARIATION RESEARCH Procedures, techniques, and methods used to isolate one type of variation from another (for example, separating product variation from test variation). VOICE OF THE CUSTOMER (VOC) Data gathered from the customers that provides information about their needs and requirements. _ A control chart which is a representation of process capability over time; displays the variability in the process average and range across time. X & R CHARTS