Download
1 / 19
190 likes | 268 Views
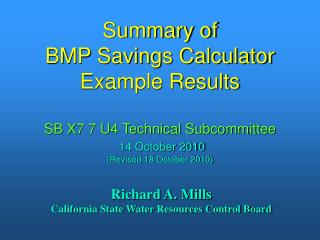
Summary of BMP Savings Calculator Example Results. SB X7 7 U4 Technical Subcommittee 14 October 2010 (Revised 18 October 2010). Richard A. Mills California State Water Resources Control Board. Presentation Overview. Summary of Calculations using David Mitchell’s Draft BMP Savings Calculator

E N D
Summary ofBMP Savings Calculator Example Results SB X7 7 U4 Technical Subcommittee14 October 2010(Revised 18 October 2010) Richard A. Mills California State Water Resources Control Board
Presentation Overview • Summary of Calculations using David Mitchell’s Draft BMP Savings Calculator • Updated version of calculator (since last U4 meeting) • Additional random example runs
Components of Calculator • CUWCC MOU BMPs • 1.2 Water loss control • 1.3 Metering • 3.1 Residential assistance • 3.2 Residential landscape • 4 CII (including toilets/urinals) • 5.2 Landscape budgets • Residential toilets • Residential washers & showerheads
28 Water Suppliers Tested • 12 non-random examples (reviewed last meeting) • 20 random examples • 4 already in non-random group • Most CUWCC members
28 Water Suppliers Tested • North Coast – 1 • San Francisco Bay – 4 • Central Coast – 2 • South Coast – 15 • Sacramento River – 4 • San Joaquin River – 1 • Tulare Lake – 1
North Coast Note: For this and following slides, the % reduction under “Calculator” is without adding any statewide adjustment factor.
San Francisco Bay *2006 baseline, incomplete/unreliable BMP data for 2005.
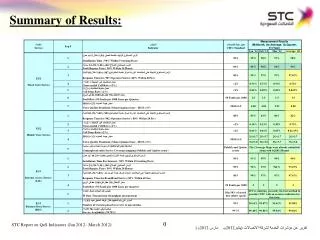
Summary Results * Weighted by population.
Additional GPCD Adjustment Required for 20% Reduction Note: For all 28 examples.
BMP-based Target v Baseline Use BMP-based Target (% reduction in baseline) Baseline Use, GPCD
North Coast North Lahontan Sacramento River San Joaquin River San Francisco Bay Tulare Lake South Lahontan Central Coast Colorado River South Coast 10 Hydrologic Regions 1 0 4 4 1 # of Examples 1 0 1 2 0 15
Population Distribution of 28 Examples 2005 Population in thousands