Download
1 / 15
150 likes | 252 Views
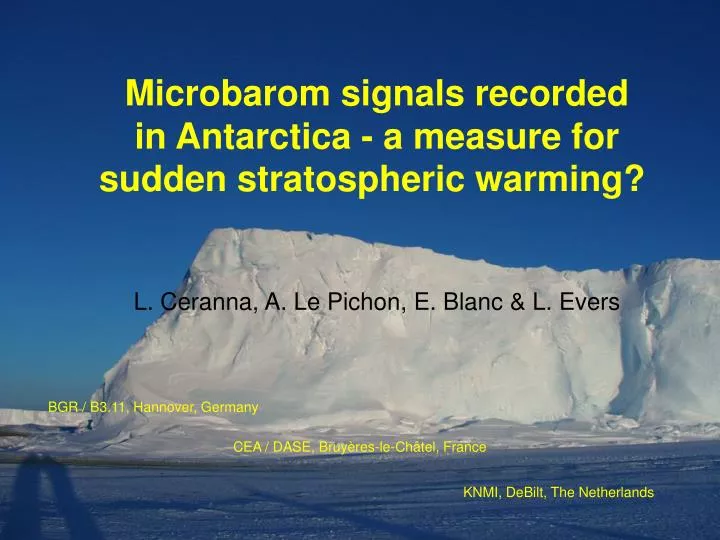
Microbarom signals recorded in Antarctica - a measure for sudden stratospheric warming? L. Ceranna, A. Le Pichon, E. Blanc & L. Evers. BGR / B3.11, Hannover, Germany. CEA / DASE, Bruyères-le-Châtel, France. KNMI, DeBilt, The Netherlands. Content. The Antarctic Infrasound Array I27DE

E N D
Microbarom signals recorded in Antarctica - a measure for sudden stratospheric warming? L. Ceranna, A. Le Pichon, E. Blanc & L. Evers BGR / B3.11, Hannover, Germany CEA / DASE, Bruyères-le-Châtel, France KNMI, DeBilt, The Netherlands
Content • The Antarctic Infrasound Array I27DE • mb-Signal Detections at I27DE • Causes and Effects • Conclusions • siting and design • microbarom signals recorded from Feb-2003 to Oct-2008 • background noise level and prevailing winds • variability of the stratospheric wave duct • sudden stratospheric warming (SSW) and its signature
71°S 72°S 5°W 10°W Siting and Design of the Infrasound Station I27DE satellite image of the Ekström Ice Shelf at the German Neumayer Research Base, Antarctica • nine element infrasound array • 2 km aperture • optimum detection conditions for mb-signals (Tdom=5 s) • noise reduction by snow coverage • continuous operation since Feb-2003
Dec - Feb Mar - Nov Track of the Ocean Swell around Antarctica • averaged 990 hPa isobar from Jun-1979 to Feb-2000 [Simmonds et al. 2003] • considered as path of the clockwise moving ocean swell around Antartica • predicted direction of continuous mb-signals throughout the years HWM-93 radial strato- spheric wind speed from source to I27DE [Hedin et al. 1996]
Detections of mb-Signals at I27DE, Feb-2003 – Oct-2008 • station azimuth follows to first order well the variation predicted by HWM-93 • trace velocities (VT) of detections are in accordance with typical range for Is phases • Austral winter 2006 is an exception • - strong decrease in number of detections • - strong increase in VT Tdur > 100 s Σ130,500 ~63 / day
Causes and Effects for anomalous mb-Signal Detection • although no comparable observations at I55US (Windless Bight, Antarctica) not an artifact, since array configuration remained unchanged • - anomaly is only limited to Austral winter 2006 • absence of a stratospheric duct, i.e. It instead of the usually prevailing Is phases • - It shows higher trace velocities compared to Is • - It is subjected to strong attenuation at 5 s period • increased background noise level due to increased prevailing wind speeds because wind speeds above 10 m/s strongly affect the detection capability • - wind speed < 10 m/s (72 %); wind speed < 15 m/s (84 %) • sudden stratospheric warming (SSW) events are known as a potential source for reduced detection capability of infrasound stations [Evers & Haak, 2005] • - more frequently in northern hemisphere (minor & major events) • - SSWare associated with a slowing down of the polar vortex leading to adecrease and sometimes to a reversal in zonal wind speed [Hoffmann et al., 2007] • - in 2002 a major SSW event observed in Antarctica [Varotsos, 2003]
mb-Signal Detection in the Periods from 01-Mar to 31-Oct Σ 20,000 > 10 m/s (29 %) no wind: ~28,000 high wind speed (increased background noise level) explains gaps in signal detection, however, it is NOT causing the reduced number of detections during Austral winter 2006 Σ 6,000 > 10 m/s (38 %) no wind: ~10,000 Σ 18,000 > 10 m/s (32 %) no wind: ~26,000
ECMWF Temperature and Wind Speed Profiles • ECMWF profiles (61/91 levels) ~ [0 70] km • between 75°S and 55°S every 1° • between 80°W and 55°E every 1° • from 01-Mar to 31-Oct every 24 h • path length: 2700 → 1000 → 1800 km source I27DE radial wind speed sound speed
Effective Sound Speed Ratios: ECMWF, HWM-93 Veff=sound speed + radial wind speed Veff-ratio=max{Veffstrat}/Veffsurf duct ECMWF averaged along path no duct duct HWM-93 averaged along path no duct • stratospheric duct always exists, even in 2006: excluding It observations • note: high Veff ratio is essential precondition for measuring high VT
Effective Sound Speed Ratios: ECMWF, 61/91 levels Veff=sound speed + radial wind speed Veff-ratio=max{Veffstrat}/max{Vefftropo} ECMWF at the source ECMWF at the station
Effective Sound Speed Profiles, averaged along Path smooth gradients ? ? • station azimuth > 0° during Austral winter are in contradiction to HWM-93 prediction, therefore, no stratospheric duct • SSW occur along with reversal in stratospheric wind direction • observed in 2005, 2006, and 2007, however, most pronounced in 2006 ? ? ? MSISE/HWM-93 ? ?
Effective Sound Speed Profiles, averaged along Path (cont.) • clear events showing increase of Veff in upper tropopause / lower stratosphere • high Veff values in the upper stratosphere, however, in 2006 lower than in 2005 and 2007 being in accordance with stratospheric cooling at that time • during Austral winter 2005 to 2007 SSW events occurred and and can be correlated to observations • Veff ratio between troposphere and stratosphere instead of ground to stratosphere ECMWF
Examples of Wave Propagation in 2006 Is IwIs 11-Jul-2006 β=-54.5° VT=370 m/s Is 11-Jul-2006 β=-38.8° VT=361 m/s Is 15-Sep-2006 β=-86.1° VT=366 m/s I27DE
Examples of Wave Propagation in 2006 (cont.) Veff in troposphere ≈ Veff in stratosphere 06-Mar-2006 β= -68.7° VT=NaN - no rays - 08-Mar-2006 β= -65.5° VT=NaN I27DE Veff in troposphere {source} > Veff in stratosphere {receiver}
Conclusions • I27DE’s siting and design are well suited for measuring mb-signals. Moreover, I27DE has been operated for more than 5 years without any major problems. • Generally, detection capability is reduced due to increased background noise level caused by prevailing wind speeds above 10 m/s. • During Austral winter 2006 an anomaly was observed for mb-signals, the number of detections was strongly reduced while trace velocities shows unusual (for Is) high values. - The high trace velocities VT might be caused by high effective sound speeds Veff in the troposphere along with relatively low values in the stratosphere (in 2006 stratospheric cooling was observed). - The reduced number might be explained by SSW events. Although such events were also observed in 2005 and 2007 (β > 0°), they were most prominent in 2006. • Detection of mb-signals is a measure for SSW events.