Download
1 / 53
530 likes | 639 Views
The NEESgrid Experience: 2000 - 2003. Tom Finholt School of Information University of Michigan

E N D
The NEESgrid Experience:2000 - 2003 Tom FinholtSchool of InformationUniversity of Michigan This work was supported primarily by the George E. Brown, Jr. Network for Earthquake Engineering Simulation (NEES) program of the National Science Foundation under award number CMS-0117853. Support was also provided by the National Science Foundation through the ITR program under award number IIS-0085951.
Outline • The earthquake engineering community • The George E. Brown, Jr. Network for Earthquake Engineering Simulation • NEESgrid – the collaboratory element of NEES • Challenges & Successes • The field of dreams
The earthquake engineering community • Research • University-based • Funded by NSF and industry • Focus on simulation • Physical models (e.g., reduced scale specimens) • Numerical models (e.g., finite element analysis) • Practice • Professional firms • Structural engineering (e.g., earthquake remediation) • Formulation of uniform building codes • Lifelines (e.g., ensure survival of roads, gaslines, power distribution)
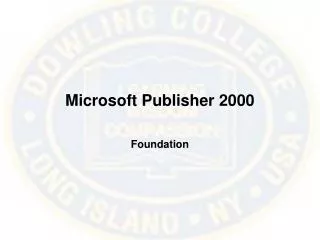
Bhuj, India. One of the towers of this apartment complex totally collapsed,and the central stairway leaned on another building of the complex.Photo courtesy of Dr. J.P. Bardet, University of Southern Californiahttp://geoinfo.usc.edu/gees/RecentEQ/India_Gujarat/Report/Damage/Bhuj/Bardet_Feb18.html
Instruments • Structural • reaction walls • shake tables • field test • Geotechnical • centrifuges • field test • Tsunami • wave basins
Survey methods • Technical surveys • Response from fourteen of fifteen sites • Practice survey (2002) • Administered to 444 engineers • 187 responses (42%) • 11% non-NEES equipment sites • 9% women • 56% students • 39% from Year 1 (26% repeat response rate)
George E. Brown, Jr. Network for Earthquake Engineering Simulation • NSF Major Research Equipment and Facility Construction award (MRE) • $82 million, 2001-04 • $10 million for system integration (NCSA, ANL, USC-ISI, Michigan, Oklahoma) • $2 million for consortium development (CUREE) • $60 million for new equipment sites • 3 shake tables (Buffalo, Nevada-Reno, UCSD) • 2 centrifuges (RPI, UC Davis) • 5 reaction walls (Berkeley, Buffalo, Colorado, Illinois, Lehigh, Minnesota) • 3 field test (Texas, UCSB/USC/BYU, UCLA) • 1 lifeline (Cornell) • 1 tsunami (Oregon State)
NEES expectations • Community survey (2002) • Stratified on region (six regions – CA, NW, SW, MW, SE, NE) and sub-field (e.g., structural, geotechnical etc.) • EERI membership roll and key tsunami mailing lists as sampling frame • n = 361 (99 responses; 27%) • Workshop survey (2002) • Registered participants in nineteen of the twenty regional workshops • The survey administration was not ready for the first workshop held in Charleston, SC • n = 287 (260 responses; 91%)
Summary of survey results • Workshop and community respondents share consensus about NEES expectations • …but level of agreement is much higher among workshop respondents • Access to experimental data is paramount • …and is more important than access to experimental facilities for both workshop and community respondents • Producing standard data formats is a critical goal • Workshop respondents skewed toward academic, structural earthquake engineers
Why is NEES exciting? • Funding • scientists recruited through the NEES equipment site program and through the NEES grand challenge program • Recognition • innovative system • highly visible to earthquake engineering and computer science communities (e.g., SC 2002 demo) • Novel capabilities • first operational use of Globus/OGSA technology • “hybrid” operations -- combining numerical and physical simulations
NEESgrid – the collaboratory element of NEES • Primary • Shared instrument • Community data system • Secondary • Distributed research center • Virtual community of practice
Technology involved • Globus/OGSA (USC ISI and ANL) • GSI and Gridftp • CHEF (Michigan) • Telepresence systems (ANL) • Data repository (NCSA) • Deployment, operations, and support (NCSA)
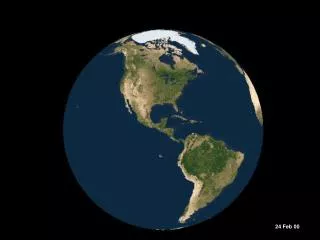
What’s A Grid? http:// Web: Uniform access to documents http:// Software catalogs Grid: Flexible, high-performance access to resources for distributed communities Computers Sensors and instruments Data archives Colleagues Source: Harvey Newman, Caltech
NEESgrid High-Level Architecture Portal, Web and 3rd Party End User Interfaces • Capabilities • data, simulation, collaboration, visualization, telepresence validated and improved via EA demonstration scenarios and delivered via • APIs and tools for users • services and interfaces at equipment and resource sites • management services for operation APIs, Tools and Libraries Supporting End User Interfaces Collaboration Services Data & Information Services TelepresenceServices Simulation & Analysis Services APIs Supporting Higher Level Information Services Grid Resource Management Middleware System Resources: Compute, Network, Data Storage, Testing Sites
System evolution • Scoping study • NCSA, ISI, ANL, UM • Alpha 1.0 • demonstrated at UNR, November 2002 • released February 2003 • Alpha 1.1 • released June 2003 • MOST experiment • real-time control of reaction wall from numerical simulation • UIUC and Colorado, July 2003
UIUC Experimental Model Colorado Experimental Model NCSA Computational Model m1 f2 f1 f2 f1 m1 Multi-Site, On-Line Simulation Test (MOST)July 2003 SAC Consortium Benchmark Structure
F1 m1, q1 f2 e f1, x1 F2 = NEESpop NEESpop NEESpop m1 f2 f1 Multi-Site, On-Line Simulation Test (MOST) UIUC Experimental Model Colorado Experimental Model SIMULATION COORDINATOR • UIUC MUST-SIM • Dan Abrams • Amr Elnashai • Dan Kuchma • Bill Spencer • and others • Colorado FHT • Benson Shing • and others NCSA Computational Model
MOST Column Test Specimens Illinois Test Specimen Colorado Test Specimen
Challenges • Confused lines of authority • Cultural differences • Different jargon • Different world views
Confused lines of authority • NEES program (2000-2004) • NEESgrid, system integration • NEES Consortium Development • 15 equipment sites • NEES Consortium (2003-2014) • Board and Executive Committee • Standing Committees
Earthquake engineers – in Hofstede’s scheme • Power distance • Hierarchical • Bias toward seniority • Individualist • “My lab is my empire” • Solo PI model • Masculine • Adversarial • Competitive • Uncertainty avoidance • Highly skeptical of new technologies • Extremely risk adverse
Grid specialists – in Hofstede’s scheme • Power distance • Egalitarian at development level • Bias toward talent • Collectivist • Use the Internet to create worldwide communities • Project model • Masculine • Adversarial • Competitive • Uncertainty avoidance • Extremely open to new technologies • Extremely risk seeking
Deployment and Operations Requirements Analysis Progress Feedback Design, Engineering, and Development How earthquake engineers think Customer Need Customer Requirements Structure Design Structure Construction Structure Acceptance Customer Needs Assessment Structure Operations
System Design System Analysis START Prelim Analysis Prelim Design Proto Evaluation More Iterations Prototyping Implementation Evaluation How grid specialists think
Successes • Scientific • First teleobservation of shake table (November 2002) • First data saved to repository (November 2002) • Community • NEES Consortium incorporated (January 2003) • First NEES Consortium meeting (May 2003) • Use of prototype tools • Future • MOST experiment, July 2003 • Operational collaboratory October 1, 2004
NEESgrid November 2002 Demonstration • Earthquake simulation at UNR early adopter site • biaxial shake table with cameras and instrumentation • 40% scale model of a two span bridge • concrete slab over steel girders • Bridge model instrumented with sensors • strain gauges, load cells, displacement, acceleration
NEESgrid November 2002 Demonstration • CHEF-based collaborative framework • Electronic notebook for data recording • Experiment management tools • data and metadata • Streaming data and video • teleobservation of experiment • data channels from sensors • Data analysis and visualization Tele-observation SAP2000 model
Prototype tool use • H.323 videoconferencing • Worktools • Placeware
Use of H.323 videoconferencing NSF LAN meetings b a c d UNR Demo a = initial ES-TF meeting; b = ES-TF meeting time changed; c = succession to new ES-TF chair; d = change to biweekly ES-TF meetings
The field of dreams I was sitting on the verandah of my farm house in eastern Iowa when a voice clearly said to me, “If you build it, he will come.” – Ray Kinsella in Shoeless Joe, by W.P. Kinsella Image source: http://www.fieldofdreamsmoviesite.com/
Building it so they will come… • Balance contributions (pp. 50-51 in the Atkins report) • Weight domain science too heavily? • Overemphasize procurement of existing technologies • Computer scientists become viewed as “merely” consultants and implementers • Weight computer science too heavily? • End user needs insufficiently addressed • Emphasis on novelty at the expense of usability and stability Source: Atkins report --http://www.communitytechnology.org/nsf_ci_report/