Download
1 / 236
2.36k likes | 2.56k Views
Youth Risk Behavior Surveillance System (YRBSS). Centers for Disease Control and Prevention. Purpose of the YRBSS. Focus the nation on behaviors among youth causing the most important health problems Assess how risk behaviors change over time Provide comparable data.

E N D
Youth Risk Behavior Surveillance System(YRBSS) Centers for Disease Control and Prevention
Purpose of the YRBSS • Focus the nation on behaviors among youth causing the most important health problems • Assess how risk behaviors change over time • Provide comparable data
Leading Causes of Death Among 10-24 Year-olds in the U.S., 1997
Impact of Sexual Behaviors • 1 million pregnancies occur each year among teenagers • 500,000 live births occur each year to teen mothers aged 15-19 years • 3,000,000 cases of sexually transmitted diseases occur each year among teenagers • 50% of new HIV infections are reported among youth 25 years and younger
Leading Causes of Death Among Persons Aged 25 Years and Older in the U.S., 1997
Federal Agencies Participating in Questionnaire Development • Centers for Disease Control and Prevention • Department of Agriculture • Department of Education • Department of Justice • Food and Drug Administration • Indian Health Service • National Cancer Institute • National Heart, Lung, and Blood Institute • National Highway Traffic Safety Administration • National Institute for Child Health and Human Development • National Institute on Alcohol Abuse and Alcoholism • National Institute of Mental Health • National Institute on Drug Abuse • Office of Disease Prevention and Health Promotion • Office of Maternal and Child Health • Office of Substance Abuse Prevention • Office of the Assistant Secretary for Planning and Evaluation, DHHS • U.S. Army Research Institute on Environmental Medicine • U.S. Consumer Product Safety Commission
YRBSS Components • State and Local School-based YRBS • National School-based YRBS • National Household-based YRBS • National College YRBS • National Alternative High School YRBS • Special Population Surveys
How YRBSS Results Are Being Used • Monitor progress in achieving National Health Promotion and Disease Prevention Objectives • Monitor progress in achieving National Education Goals • Monitor progress in achieving American Cancer Society Measures of Success for school health education • Focus school health education teacher training and instructional programs • Support school health programs
National Alternative High School Youth Risk Behavior Survey (ALT-YRBS), 1998 Centers for Disease Control and Prevention
Percentage of respondents, by gender National Alternative High School Youth Risk Behavior Survey, 1998.
Percentage of respondents, by race/ethnicity National Alternative High School Youth Risk Behavior Survey, 1998.
Percentage of respondents, by grade National Alternative High School Youth Risk Behavior Survey, 1998.
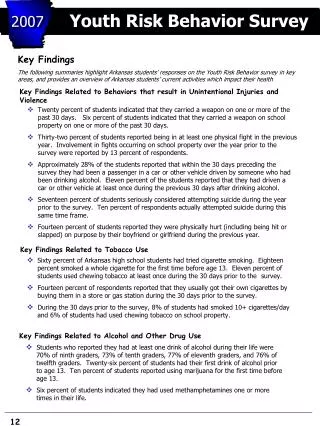
Definition of Alternative High Schools • Students are at risk for failing or dropping out of school • Students have been removed from their regular school due to drug use, violence, or other illegal or behavioral problems National Alternative High School Youth Risk Behavior Survey, 1998.
Characteristics • 9th-12th grade students • Probability samples of schools and students • Anonymous • Self-administered 88-item questionnaire • Completed in one class period (45 minutes) • Computer scannable questionnaire National Alternative High School Youth Risk Behavior Survey, 1998.
Response Rates • School response rate: 81% • Student response rate: 82% • Overall response rate: 66% National Alternative High School Youth Risk Behavior Survey, 1998.
School Types National Alternative High School Youth Risk Behavior Survey, 1998.
Student Population Served Percent of Students • Pregnant 6% • Adjudicated 8% • Behavioral or emotional problems 13% • Multiple types of populations 74% National Alternative High School Youth Risk Behavior Survey, 1998.
Percentage of high school students who rarely or never wore seat belts,* by sex *When riding in a car or truck driven by someone else. National Alternative High School Youth Risk Behavior Survey, 1998.
Percentage of high school students who rarely or never wore seat belts,* by race / ethnicity *When riding in a car or truck driven by someone else. National Alternative High School Youth Risk Behavior Survey, 1998.
Percentage of high school students who rarely or never wore seat belts,* by grade *When riding in a car or truck driven by someone else. National Alternative High School Youth Risk Behavior Survey, 1998.
Percentage of high school students who rarely or never wore motorcycle helmets,* by sex *Among the 27.1% of students who rode motorcycles during the 12 months preceding the survey. National Alternative High School Youth Risk Behavior Survey, 1998.
Percentage of high school students who rarely or never wore motorcycle helmets,* by race / ethnicity *Among the 27.1% of students who rode motorcycles during the 12 months preceding the survey. National Alternative High School Youth Risk Behavior Survey, 1998.
Percentage of high school students who rarely or never wore motorcycle helmets,* by grade *Among the 27.1% of students who rode motorcycles during the 12 months preceding the survey. National Alternative High School Youth Risk Behavior Survey, 1998.
Percentage of high school students who rarely or never wore bicycle helmets,* by sex *Among the 68.7% of students who rode bicycles during the 12 months preceding the survey. National Alternative High School Youth Risk Behavior Survey, 1998.
Percentage of high school students who rarely or never wore bicycle helmets,* by race / ethnicity *Among the 68.7% of students who rode bicycles during the 12 months preceding the survey. National Alternative High School Youth Risk Behavior Survey, 1998.
Percentage of high school students who rarely or never wore bicycle helmets,* by grade *Among the 68.7% of students who rode bicycles during the 12 months preceding the survey. National Alternative High School Youth Risk Behavior Survey, 1998.
Percentage of high school students who rode with a driver who had been drinking alcohol,* by sex *One or more times during the 30 days preceding the survey. National Alternative High School Youth Risk Behavior Survey, 1998.
Percentage of high school students who rode with a driver who had been drinking alcohol,* by race / ethnicity *One or more times during the 30 days preceding the survey. National Alternative High School Youth Risk Behavior Survey, 1998.
Percentage of high school students who rode with a driver who had been drinking alcohol,* by grade *One or more times during the 30 days preceding the survey. National Alternative High School Youth Risk Behavior Survey, 1998.
Percentage of high school students who drove after drinking alcohol,* by sex *One or more times during the 30 days preceding the survey. National Alternative High School Youth Risk Behavior Survey, 1998.
Percentage of high school students who drove after drinking alcohol,* by race / ethnicity *One or more times during the 30 days preceding the survey. National Alternative High School Youth Risk Behavior Survey, 1998.
Percentage of high school students who drove after drinking alcohol,* by grade *One or more times during the 30 days preceding the survey. National Alternative High School Youth Risk Behavior Survey, 1998.
Percentage of high school students who carried a weapon,* by sex *Such as a gun, knife, or club on one or more of the 30 days preceding the survey. National Alternative High School Youth Risk Behavior Survey, 1998.
Percentage of high school students who carried a weapon,* by race / ethnicity *Such as a gun, knife, or club on one or more of the 30 days preceding the survey. National Alternative High School Youth Risk Behavior Survey, 1998.
Percentage of high school students who carried a weapon,* by grade *Such as a gun, knife, or club on one or more of the 30 days preceding the survey. National Alternative High School Youth Risk Behavior Survey, 1998.
Percentage of high school students who carried a gun,* by sex *On one or more of the 30 days preceding the survey. National Alternative High School Youth Risk Behavior Survey, 1998.
Percentage of high school students who carried a gun,* by race / ethnicity *On one or more of the 30 days preceding the survey. National Alternative High School Youth Risk Behavior Survey, 1998.
Percentage of high school students who carried a gun,* by grade *On one or more of the 30 days preceding the survey. National Alternative High School Youth Risk Behavior Survey, 1998.
Percentage of high school students who were in a physical fight,* by sex *One or more times during the 12 months preceding the survey. National Alternative High School Youth Risk Behavior Survey, 1998.
Percentage of high school students who were in a physical fight,* by race / ethnicity *One or more times during the 12 months preceding the survey. National Alternative High School Youth Risk Behavior Survey, 1998.
Percentage of high school students who were in a physical fight,* by grade *One or more times during the 12 months preceding the survey. National Alternative High School Youth Risk Behavior Survey, 1998.
Percentage of high school students who were injured in a physical fight seriously enough to be treated by a doctor or nurse,* by sex *One or more times during the 12 months preceding the survey. National Alternative High School Youth Risk Behavior Survey, 1998.
Percentage of high school students who were injured in a physical fight seriously enough to be treated by a doctor or nurse,* by race / ethnicity *One or more times during the 12 months preceding the survey. National Alternative High School Youth Risk Behavior Survey, 1998.
Percentage of high school students who were injured in a physical fight seriously enough to be treated by a doctor or nurse,* by grade *One or more times during the 12 months preceding the survey. National Alternative High School Youth Risk Behavior Survey, 1998.
Percentage of high school students who felt it was too unsafe to go to school,* by sex *On one or more of the 30 days preceding the survey. National Alternative High School Youth Risk Behavior Survey, 1998.
Percentage of high school students who felt it was too unsafe to go to school,* by race / ethnicity *On one or more of the 30 days preceding the survey. National Alternative High School Youth Risk Behavior Survey, 1998.
Percentage of high school students who felt it was too unsafe to go to school,* by grade *On one or more of the 30 days preceding the survey. National Alternative High School Youth Risk Behavior Survey, 1998.
Percentage of high school students who carried a weapon on school property,* by sex *Such as a gun, knife, or club on one or more of the 30 days preceding the survey. National Alternative High School Youth Risk Behavior Survey, 1998.
Percentage of high school students who carried a weapon on school property,* by race / ethnicity *Such as a gun, knife, or club on one or more of the 30 days preceding the survey. National Alternative High School Youth Risk Behavior Survey, 1998.
Percentage of high school students who carried a weapon on school property,* by grade *Such as a gun, knife, or club on one or more of the 30 days preceding the survey. National Alternative High School Youth Risk Behavior Survey, 1998.