Download

1 / 35
380 likes | 593 Views
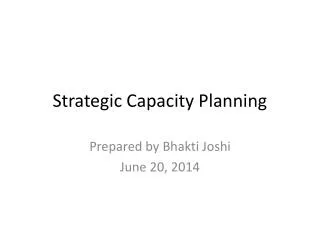
Strategic Capacity Management. Dr. Ron Lembke Operations Management. Maximum Throughput of a Process. What is the capacity of the system? Should we add any capacity? How should we run the system? Where should we keep inventory?. 50/hr. 20/hr. 10/hr. 40/hr.

E N D
Strategic Capacity Management Dr. Ron Lembke Operations Management
Maximum Throughput of a Process • What is the capacity of the system? • Should we add any capacity? • How should we run the system? • Where should we keep inventory? 50/hr 20/hr 10/hr 40/hr
Maximum Throughput of a Process • What is the capacity of the system? • Convert to units / hr 6 min 4 min 5 min 5 min 10/hr 15/hr 12/hr 12/hr
Productivity • Productivity = Outputs / Inputs • Partial: Output/Labor or Output/Capital • Multifactor: Output / (Labor + Capital + Energy ) • Total Measure: Output / Inputs
Automotive Productivity • Book Data: • Jaguar: 14 cars/employee • Volvo: 29 cars/employee • Mini: 39 cars/employee
US Productivity Growth Source: Bureau of Labor Statistics
Total Factor Productivity Increases • Take labor and capital into account • “percentage increase in output that is not accounted for by changes in the volume of inputs of capital and labour.” Source: Economist, 2009
Growth of Service Economy % of Labor Force
U.S. Productivity Gains • Services harder to make more productive • Product Development team structure (Eg: Chrysler Prowler, Boeing 787) • Facilities improvements (less WIP, better quality, flexibility) • Keiretsu-like supplier cooperation -- tight cooperation
U. S. Productivity Gains • Increased 1.37% per year 1990-95 • Increased 2.37% per year 1995-98 • Potential sources of productivity gains: • Capital investment (1.13%) • Labor Quality (0.25%) • Technological progress (0.99%) • Computers really are making us more productive.Source: WSJ, 8/1/00, “Further Gains in Productivity are Predicted,” A2
Improving Productivity • Develop productivity measurements– you can’t improve what you can’t measure • Identify and Improve bottleneck operations first • Establish goals, document and publicize improvements
Hours Worked by Country Average Source: OECD, 2012
Hours Worked and Productivity Source: Eurofund, European Working Conditions Observatory, 2012
What Would Henry Say? • Ford introduced the $5 (per day) wage in 1914 • He introduced the 40 hour work week • “so people would have more time to buy” • It also meant more output: 3*8 > 2*10 • “Now we know from our experience in changing from six to five days and back again that we can get at least as great production in five days as we can in six, and we shall probably get a greater, for the pressure will bring better methods. • Crowther, World’s Work, 1926
Forty Hour Week • Ernst Abbe, Karl Zeiss optics • 1896: as much done in 9 as in 8.
Marginal Output of Time • Value of working n hrs is Onda • As you work more hours, your productivity per hour goes down • Eventually, it goes negative. • Better to work b instead of e hrs S.J. Chapman, 1909, “Hours of Labour,” The Economic Journal 19(75) 353-373
“Crunch Mode” • Ea_spouse: 12/04 • “Pre-crunch” • SO was working 7 * 13: 91 per week! • Maybe time off at 6pm Saturday • $5k signing bonus, couldn’t quit • Class action: April ‘06 $14.9m • Igda.org “Why Crunch Mode Doesn’t Work: 6 Lessons”
Learning Curves • time/unit goes down consistently • Down by 10% as output doubles • We can use Logarithms to approximate this • What will our cost per unit be when we’ve made 10,000 units? • If you ever need this, email me, and we can talk as much as you want • Also, see Appendix B
Example 1 Demand for each product, by year. • Paul’s 1 2 3 4 5 Bottles 60 100 150 200 250 Bags 100 200 300 400 500 • Newman’s Bottles 75 85 95 97 98 Bags 200 400 600 650 680
Example 1 • Totals 1 2 3 4 5 Bottles 135 185 245 297 348 Bags 300 600 900 1,050 1,180 • bottle machines 150k/yr • Three currently = 150 * 3 = 450k • bag machines 250k/yr • Five currently = 250 * 5 = 1,250k
Example 1 • Bottles 135 185 245 297 348 Machines 1 2 2 2 3 Mach. usage 0.9 1.23 1.63 1.98 2.32 Workers 1.8 2.46 3.27 3.96 4.64 (2 workers per machine) • Bags 300 600 900 1,050 1,180 Machines 2 3 4 5 5 Mach Usage 1.2 2.4 3.6 4.2 4.7 Workers 3.6 7.2 10.8 12.6 14.1 (3 workers per machine)
Capacity Tradeoffs • Can we make combinations in between? 120,000 4-door cars 150,000 Two-door cars
How much do we have? • We can only sustain so much effort. • “Best Operating Level” • Output level process designed for • Lowest cost per unit • Capacity utilization = capacity used best operating level • Hard to run > 1.0 for long
Time Horizons • Long-Range: over a year – acquiring, disposing of production resources • Intermediate Range: Monthly or quarterly plans, hiring, firing, layoffs • Short Range – less than a month, daily or weekly scheduling process, overtime, worker scheduling, etc.
Service Differences • Arrival Rate very variable • Can’t store the products - yesterday’s flight? • Service times variable • Serve me “Right Now!” • Rates change quickly • Schedule capacity in 10 minute intervals, not months • How much capacity do we need?
Capacity Levels in Service =100% Mean arrival rate, Zone of non-service < =70% Critical Zone 100 Zone of service 50 100 150 Mean service rate,
Adding Capacity • Expensive to add capacity • A few large expansions are cheaper (per unit) than many small additions • Large expansions allow of “clean sheet of paper” thinking, re-design of processes • Carry unused overhead for a long time • May never be needed
Reengineering • “Business Process Reengineering” (Hammer and Champy) • Companies grow over time, adding plants, lines, facilities, etc. • Growth may not end in optimal form • Re-design processes from ground up
Capacity Planning • How much capacity should we add? • Conservative Optimistic • Forecast possible demand scenarios (Chapter 11) • Determine capacity needed for likely levels • Determine “capacity cushion” desired
Toyota Capacity 1997: Cars and vans? That’s crazy talk First time in North America 292,000 Camrys 89,000 Siennas 89,000 Avalons
Capacity Sources • In addition to expanding facilities: • Two or three shifts • Outsourcing non-core activities • Training or acquisition of faster equipment
Decision Trees • Consider different possible decisions, and different possible outcomes • Compute expected profits of each decision • Choose decision with highest expected profits, work your way back up the tree.
Summary Having enough capacity is crucial Measured productivity (single and multi-factor) Increasing productivity key to economic growth and profits Computed number of machines and employees needed Making employees more productive is often cheaper than adding machines