Download
1 / 24
240 likes | 342 Views
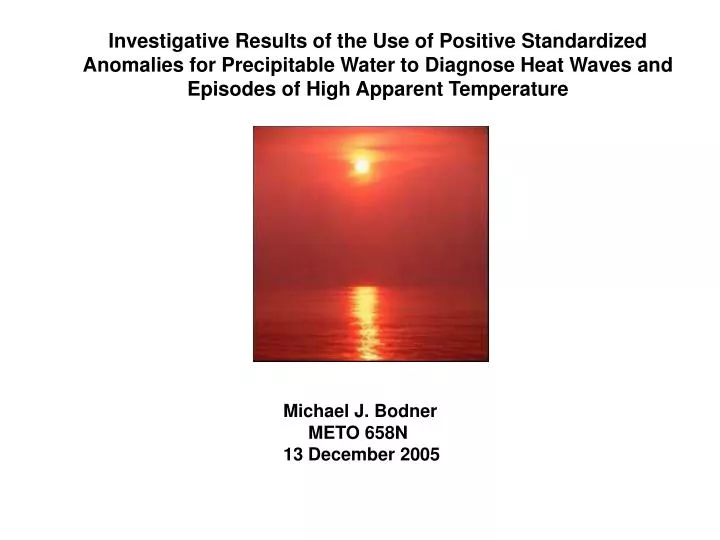
Investigative Results of the Use of Positive Standardized Anomalies for Precipitable Water to Diagnose Heat Waves and Episodes of High Apparent Temperature. Michael J. Bodner METO 658N 13 December 2005. Presentation Outline. Review heat problem and origin of work

E N D
Investigative Results of the Use of Positive Standardized Anomalies for Precipitable Water to Diagnose Heat Waves and Episodes of High Apparent Temperature Michael J. Bodner METO 658N13 December 2005
Presentation Outline • Review heat problem and origin of work • Overview of atmospheric conditions conducive to heat waves • Link between heat events and high precipitable water concentration • Review of significant 5 day or greater heat events • Review of monthly data • Summary/Conclusions
Heat Wave Impacts • Increased heat related illnesses and fatalities • Heat related fatalities often exceed those resulting from tornado, flood and hurricane events. • Economic impact – agricultural loss and higher energy costs • Environmental – poor air quality (higher ground level ozone concentration)
Meteorological Characteristics of Heat Waves • Strong positive 500 hPa height anomalies • Ridges can persist for 3-7 days or for as long as several weeks such as the 1980, 1952-54, 1934 and 1936 heat episodes (Namias 1982) • Strong positive 850 hPa temperature anomalies • *Anomalously high surface temperatures combined with high levels of lower tropospheric moisture generate high apparent temperature or “heat index”. (Steadman 1979)
What causes an increase in lower tropospheric moisture? • Shifts in general circulation and storm track (Lyon and Dole 1995) – Heat events are not always equated with drought conditions • Local, mesoscale effects such as a surplus of soil mositure and evapotranspiration (Kunkel 1990) • Precipitable water can be used to diagnose drought conditions which often times leads to high temperature anomalies (Chang et al. 2001 )
A paper presented at the August 2005 AMS Conference in Washington D.C. by Lipton et al. sparked my interest in this work. It was suggested in the paper that abnormally high precipitable water may contribute to the formation and/or severity of heat waves. • Positive standardized anomalies of precipitable water may limit long wave radiation cooling at night which may then contribute to high daytime temperatures during the ensuing days of the heat wave • A plume of positive precipitable water standardized anomalies often forms along the top (north side) of the upper tropospheric ridge during a heat event • High precipitable water may contribute to high apparent temperatures whenever they intersect with high thermal anomalies at the surface and lower troposphere.
Data/Methodology • A daily climatology derived from NCEP/NCAR Reanalysis Data was used to compute a June, July, August (JJA) standard deviation of precipitable water • Using the large standard deviation center over the central U.S. as a domain, 500 hPa geopotential height anomalies, 850 hPa thermal standardized anomalies and precipitable water standardized anomalies were computed for 8 significant heat events over the central U.S. • Using the same data set monthly standardized anomalies were computed for July 1950-2003 then compared with monthly surface temperature anomalies. • 850 hPa moisture flux was computed for several significant 5 day and monthly events • Surface temperature anomaly data was obtained from the Climate Diagnostic Center (CDC) • Apparent temperatures were calculated fusing surface dry bulb temperatures and dew point temperatures obtained from NCDC’s Local Climate Data
Large standard deviations of JJA precipitable water can be found over the Northern Baja and Gulf of California, over the western North Atlantic and the Central U.S.
25-30 July 1999 – a weaker PW standardized anomaly 25-30 July 1999
Maximum Daytime and Average Nocturnal Heat Indices 12-17 July 1995 and 25-30 July 1999
Summary • On the 5 day synoptic scale, positive anomalies of precipitable water concentration can be used to diagnose most high heat and apparent temperature events • Positive PW standardized anomalies can influence high apparent temperatures at night, particularly during June and July • Variability in 850 hPa wind fields and moisture flux does not portend well for the development of a diagnostic or prediction index • On the monthly time scale, the large scale circulation is likely to drive moisture variability in the lower and middle troposphere – PWs can be used to diagnose drought but not much skill expected with monthly temperature
Future Work • Better observational data containing heat indices needs to be developed from archived surface temperature and dew point data to provide better verification (the Climate Prediction Center (CPC) began archiving observational heat index data in 2002) • Compute lead/lag correlations of precipitable water concentration and lower tropospheric temperature for the 5 day time scale to test and potentially develop a prediction index • Obtain soil moisture data for future studies to investigate evaporation/transpiration processes • Factoring standardized anomalies of the central U.S. low level jet into the diagnosis (for nocturnal (diurnal) coupling (decoupling ) • Incorporate one or more annular modes into monthly analysis
ReferencesChang, F.C. and E.A. Smith, 2001: Hydrological and Dynamical Characteristics of Summertime Droughts over U.S. Great Plains. Journal of Climate, 14, 2296-2316. Kunkel, K.E., S.A. Changnon, B.C. Reinke, and R.W. Arrit, 1996: The July 1995 Heat Wave in the Midwest: A Climate Perspective and Critical Weather Factors. Bulletin of the American Meteorological Society, 77, 1507-1518. Kunkel, K.E. , 1990: Operational Soil Estimation for the Midwestern United States. Journal of Applied Meteorology, 29, 1158-1166. Lipton, K.L., R.H. Grumm, R. Holmes, P. Knight, and J. Ross, 2005: Forecasting Heat Waves using Climatic Anomalies. Preprints P1.60, Weather Forecasting and Analysis/Numerical Weather Prediction Conference ,Washington D.C., August 2005. Lyon, B., and R. Dole, 1995: A Diagnostic Comparison of the 1980 and 1988 U.S. Summer Heat Wave- Droughts. Journal of Climate, 8, 1658-1675. Namias, J., 1982: Anatomy of Great Plains Protracted Heat Waves. Monthly Weather Review, 110, 824-838. Schar, C., and G. Jendritzy, 2004: Hot News from the Summer of 2003. Nature, 432, 559-560. Steadman, R.G., 1979: The Assessment of Sultriness. Part 1: A Temperature-Humidity Index Based on Human Physiology and Clothing Science. Journal of Applied Meteorology, 18, 861-873.