Download
1 / 36
360 likes | 518 Views
Time Substitution and Network Effects with an Application to Science Policy for US Universities Hirofumi Fukuyama Fukuoka University William L. Weber Southeast Missouri State University Yin Xia Columbia, Missouri March 16, 2013.

E N D
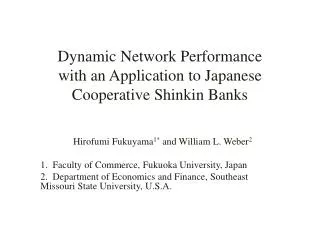
Time Substitution and Network Effects with an Application to Science Policy for US Universities Hirofumi Fukuyama Fukuoka University William L. Weber Southeast Missouri State University Yin Xia Columbia, Missouri March 16, 2013
Knowledge spillovers-from university to university and from period to period “If I have seen further it is by standing on the shoulders of giants.” Paul Samuelson quoting Isaac Newton at the 1971 Nobel Prize Ceremony
Is US Economic Growth Over? Faltering Innovation Confronts the Six Headwinds By Robert J. Gordon, NBER August 2012
Science and Productivity GrowthJ. Adams (1990) JPE- 15 to 20 year time lag. Approximately 15% of slowdown in productivity growth in the 1970s is explained by decline in scientists and engineers during WWII. Knowledge stocks add 0.5% to annual productivity growth.Jones and Williams (1998)-QJE-private return to R&D is 7%. Social return is 30%. Mansfield (1995)-RESTAT-Academic research resulted in new commercialized products accounting for 8.9% of sales and cost savings of 3.5% of sales during 1991-94. Lag between academic research and commercialization is falling. Federal spending on science and private R&D=1.25% of GDP in 1976, =1% in 2009 (2012 Economic Report of the President)
Bayh-Dole Act of 1980-Allowed universities and private companies to obtain patents and license inventions that were the result of federal spending. • Concern-Basic research is a public good. • Boldrin and Levine (2009)-AER, Just and Huffman (2009)-Res. Policy-When universities are granted monopoly power via patents fewer resources are allocated to production of new knowledge relative to industrial applications. • Basic research and applied research (patenting) are complementary-Thursby and Thursby (2002)-Manag.Sci., Azoulay, Ding, and Waverly (2009)-J. Indus. Ec., Fabrizio and DiMinin (2008)-Res. Policy. • Weber and Xia (2011)-Am. J. Ag. Ec.-Morishimaelasticities of transformation-As patents increase, shadow revenue share of patents increases relative to shadow revenue share of publications.
What is Nanotechnology? “Nanotechnology is the understanding and control of matter at dimensions of roughly 1 to 100 nanometers, where unique phenomena enable novel applications.” “At the nanoscale, the physical, chemical, and biological properties of materials differ in fundamental and valuable ways from the properties of individual atoms and molecules or bulk matter.” — National Nanotechnology Initiative (NNI)
Companies Spawned by National Science Foundation (NSF) Grants To Universities Acoustic Magic, ALEKS Corp. , Allylix Inc., Amati Communications Corp. Arbor Networks, Audyssey Laboratories, Chromatin Inc., Cognex Corp., Directed Vapor Technologies International, Eden Park Illumination, Genentech, Google, Integrated Genomics, J.A. Woollam Co., Konix, Lehigh Nanotech, Mersive Technologies, MicroMRI, Molecular Imaging, NanoMas Technologies, NanopharmaTechnologies, Pacific Biosciences, PolyMedix, RainDance Technologies, Reactive Nanotechnologies, Seaside Therapeutics, Semiprius, SenSound, Sinmat, Solarmer Energy, Spin Transfer Technologies, Vorbeck Material Corp., Webscalers Biotechnology/pharmaceuticals-5 Nanotechnology-7
International Government R&D Spending on Nanotechnology Source: Roco, M. Journal of Nano Research (2005), 707.
Number of Nanobiotechnology journal articles by Sample Universities, 1990-2006
Output Possibility Set Directional Distance Function
Knowledge inputs in period t+1 From period t-1
Network Models • Färe, R. and Grosskopf, S. (1996- Ec. Letters, 2000-SEPS) • Kao and Hwang (2008)- EJOR • Tone and Tsutsui (2009)-EJOR • Chen, Cook and Zhu (2010)-EJOR Fukuyama and Weber (2010-Omega, 2011-IJORIS) Akther, Fukuyama, and Weber (2012)-Omega Dynamic Models Shephard and Färe (1980) Färe and Grosskopf (1996, 2000) Bogetoft, Färe, Grosskopf, Hayes, and Taylor (2009)-JORS-Japan Tone and Tsutsui (2009) Fukuyama and Weber (2012)-
Output Possibility Sets Government agency (NSF) wants to allocate the variable input so as to maximize the aggregate size of the production possibility sets in a given period
Time Substitution-When to begin use of an input and for how long . t T Shephard and Färe (1980) Färe and Grosskopf (1996) Färe, Grosskopf, and Margaritis (2010) Färe, Grosskopf, Margaritis, and Weber (2011)
For University k Technological Progress-Delay the starting period, Technological Regress-Begin production early. Increasing returns to scale-Use input intensively, small Decreasing returns to scale-Use equal amounts of input in each period
Three outputs-publications, patents, Ph.D. students Fixed inputs-University R&D spending in the life sciences, engineering, and physical sciences Variable input-NSF grants for nanotechnology Own knowledge input-university’s past publications Spillover knowledge input-past publications from other universities Data-1990-2005 Three year moving average of all outputs and inputs. Lose one observation since lagged knowledge outputs enter the current period technology. Model is estimated for 1993-2005 for 25 universities Directional vector=g=(1,1,1)
Knowledge Outputs at 25 US universities Publications in nanobiotechnology Patents in nanobiotechnology Ph.D. students in nanobiotechnology
Mean Actual and Optimal Values of Std. Dev. In parentheses
Summary and Conclusions • Slowdown in productivity growth in US and other countries • Social return to R&D high relative to private return • Academic Research has spawned new firms. • Nanobiotechnology knowledge outputs/inputs integrated into a dynamic network model • Estimates indicate between 91 and 184 extra publications, patents, and Ph.D. students from realizing greater efficiency and through reallocation of NSF funds. • University winners and losers-political process limits the extent of reallocation resulting in smaller potential gains.