Download

1 / 29
290 likes | 390 Views
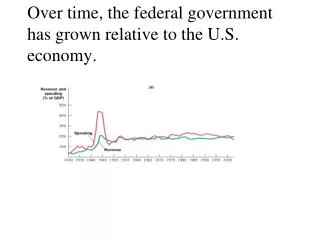
Spp2 Topic 2: U.S. Economy and Markets Over Time. Xiaozhen Chen Hai Tran. U.S. Real GDP. U.S. Real GDP. Recession. Recession. U.S. Real GDP Explanation. According to the select data, It shows that the U.S. Real GDP is increase over time from 1984 to 2009 in general.

E N D
Spp2 Topic 2: U.S. Economy and Markets Over Time Xiaozhen Chen Hai Tran
U.S. Real GDP Recession Recession
U.S. Real GDP Explanation • According to the select data, It shows that the U.S. Real GDP is increase over time from 1984 to 2009 in general. • Although there is an increase in general, we found two declines that the U.S. economy experienced in this period. • Those two decline periods are from 1990 to 1991 and from 2008 to 2009.
U.S. Real GDP Explanation • Recall that real GDP is the gross domestic product measured in terms of the price level in a base period. • Where GDP is the total market value of all final goods and services produced annually within the borders of the United States, whether by U.S. or foreign-supplied resources. • Also, Economic growth is the expansion of real GDP (or real GDP per capita) over time. • Recession is a period of general economic decline, defined usually as a contraction in the GDP for six months or longer .
U.S. Real GDP Explanation • Therefore, the U.S. economic is growth over time since the real GDP increase. • the U.S. is in a recession in the period from 1990 to 1991 and from 2008 to 2009 because the real GDP is decrease. The U.S. economic is decline in these period. • From the graph, we found out that there was another decline during 2000 to 2001,but the data in the data table shows that was a slightly increase from 11,226,000 to 11,347,200 during this period. therefore, we believed there was a short period of recession in some months during this period.
S&P 500 Stock Market, Price index and Volume Declines Decline Decline
S&P 500 Stock Market, Price Index and Volume Decline Decline Decline
S&P 500 Stock Market, Price Index and Volume Explanation • The S&P 500 Composite Stock Price Index is an index of 500 stocks from major industries of the U.S. economy. There are indices for almost every conceivable sector of the economy and stock market. • According to the data table and graph above, there are four significant declines in the price index during the period 1984 to 2009 for the S&P 500 Stock Market. • These periods are from 1989 to 1990; 1993 to 1994, 1999 to 2002 and 2007 to 2008.
S&P 500 Stock Market, Price Index and Volume Explanation • Also, we found three declines during the period 1984 to 2009 in the volume for the S&P 500 Stock Market in the graph. • Those periods are from 1987 to 1988, 2001 to 2002 and 2008 to 2009. • But, we found another period has a decline on the volume from the data table, which is 1989 to 1990. Maybe because it is just slightly decline from 167968000 to 191548000, the graph is not detail enough to show this decline.
S&P 500 Stock Market, Price Index and Volume Explanation • According to a web, if a stock is truly in a healthy uptrend, then volume should rise as prices rise. Negative volume divergence is where price is rising, but volume is declining. This divergence indicates that even though demand still outweighs supply, buyers are not willing to pay up to own the stock. • Therefore, we conclude that during the period 1987 to 1988 and 2008 to 2009 there were a negative volume divergence in the stock market because the price of the stock is rise but the volume declines. • Also, we are conclude that the period from 1987 to 1988, 1989 to 1990, 1993 to 1994, 1999 to 2002 and 2007 to 2009, the stock market is unhealthy because the price and volume of the stock are not increase or decrease at the same time during those period. • Those declines in price and volume could lead the economy market to a recession because recall that one of the factor that cause a recession is typically accompanied by a drop in the stock market.
New car market, average price and quantity sold Decline Declines
New car market, average price and quantity sold • There were three declines in the new car market average price during the time from 1984 to 2009. • Those average price for new car market declines periods were from 1997 to 2001, 2002 to 2003 and 2006 to 2008. • There were six declines in the quantity sold of the new car market during the time from 1984 to 2009. • Those periods were from 1985 to 1987, 1989 to 1991, 1994 to 1995, 1999 to 2001, 2006 to 2007 and 2008 to 2009.
New house market, average price and quantity sold Recession Recession
New house market, average price and quantity sold Declines Declines Decline
New house market, average price and quantity sold • From the graph and the data table, we found two declines in the price in the year from 1984 to 2009 • Those declines on new house market average price periods are from 1990 to 1991 and from 2007 to 2009. • The new house market are faced five declines on the quantity house sold during those years. • They were in the period of 1986 to 1987, 1988 to 1991, 1994 to 1995 , 1998 to 1999 and 2005 to 2009.
New house market, average price and quantity sold • Recall that one piece that cause the recession is a decline in the housing market. • The decrease on the price and quantity of house sell on those period could cause a recession. And the current recession from 2007 to 2009 is a good example. The house price and quantity drop serious and make the economy market into a serious recession. • One interesting that we discover is that the quantity of the house sold from 2007 to 2009 is less than from 1984 to 1985. It is so bad for our economy.
S&P 500 Explanation • From 1984 to 2007: • Volume and price of stock increased. • Demand stock increased shift the demand curve to right. • Demand dominated supply from 1984 to 2007. • From 2007 to 2010: • Volume of stock increased while price decreased. • Supply stock increased shift the supply curve to right. • Supply dominated demand from 2007 to 2010.
Work Cited • http://www.businessdictionary.com/definition/price-index.html • http://www.sec.gov/answers/indices.htm • http://www.investorwords.com/4086/recession.html • http://www.measuringworth.com/ • http://finance.yahoo.com/ • http://www.economagic.com/nipa.htm#U7 • http://www.huduser.org/portal/periodicals/ushmc/summer10/hist_data.pdf