Download
1 / 6
70 likes | 231 Views
Flavour Tally. Insert any other flavours here. Mission Two:. Change the frequency table into a pictogram by using a symbol to represent 2 books. Bar charts are a common way to display information. Number of books read. Reading Group. 8. 7. 6. 5. 4. 3. 2. 1.

E N D
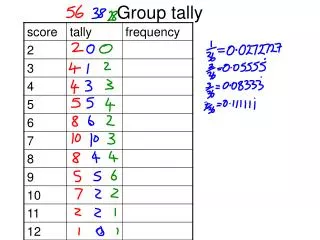
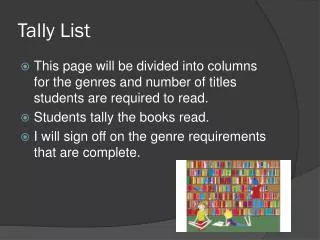
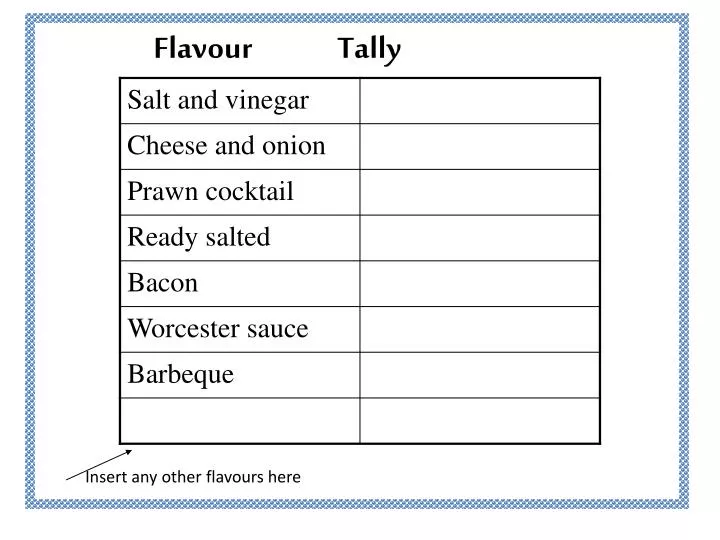
Flavour Tally Insert any other flavours here
Mission Two: Change the frequency table into a pictogram by using a symbol to represent 2 books.
Bar charts are a common way to display information Number of books read Reading Group
8 7 6 5 4 3 2 1 What does this bar chart show? How many children were surveyed? Which is the favourite flavour? Which is the least liked? What intervals are used on the y axis? What intervals could you use if twice as many children were surveyed? Can you read the answers? Favourite Crisps Number of children 0 Salt and vinegar Cheese and onion Prawn cocktail Ready salted Bacon Worcester sauce Barbeque Flavours
Mission Two: Represents two books Change the frequency table into a pictogram by using a symbol to represent 2 books. Badgers Tigers Peacocks Elephants Pigs Spiders
Mission Four: Work in pairs to find a symbol that could represent 5 books. Represents Five books Badgers Tigers MISSION FOUR COMPLETED Peacocks Elephants Pigs Spiders