Download
1 / 23
230 likes | 364 Views
Surface current mapping in the lower Chesapeake Bay. Teresa Garner Larry Atkinson. Introduction to HFRADAR Sites & Data Circulation in the Bay Tidal Sub- tidal Quality Control Efforts Instrument Comparisons Pattern Measurements New Test Site in Bay New Visualization Software.

E N D
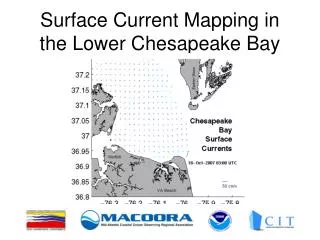
Surface current mapping in the lower Chesapeake Bay Teresa Garner Larry Atkinson
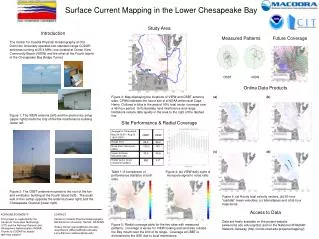
Introduction to HFRADAR Sites & Data • Circulation in the Bay • Tidal • Sub-tidal • Quality Control Efforts • Instrument Comparisons • Pattern Measurements • New Test Site in Bay • New Visualization Software
Gaps > 1 week Chesapeake Bay Data Coverage Missing times in blue. RADAR Sites 2009 2010 2008 Summer Winter 90% Coverage shown in green.
Sunset BeachTest Site Provided by NOAA
Current Reversals Apr 10 2007 – Aug 31 2010 2 hours: 153 3 hours: 111 4 hours: 67 5 hours: 38 6 hours: 11
Comparisons with NOAA PORTS Doppler Current Profilers CPHN York Spit (YS) Cape Henry (CH) Thimble Shoals (TS) RADAR RADAR RADAR ADCP ADCP ADCP
ADCP Along-Channel Comparisons Aug 21 2010 0:00 – Sep 21 2010 23:00 UTC Cape Henry Station Thimble Shoals Station RADAR cm/s RADAR cm/s ADCP cm/s ADCP cm/s
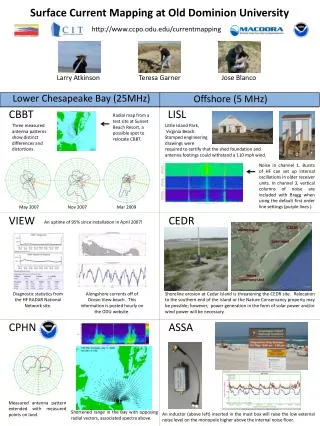
Antenna Pattern Smoothing CBBT July 2010 VIEW May 2007 Loop1 red Loop2 blue Smoothing 0, 5 & 10 degrees What difference does it make?
R1 Only: 96 count (red) R2 Only: 66 count (blue) Velocity Differences (R1-R2) for All Shared Radials: 783 count R1 slower (pink/red) R2 slower (cyan/blue) Darker shades > 30 cm/s Average Speed Difference = 10.3 cm/s CBBT Direction Changes (Subset of Shared Radials: 82 count) Average Speed Difference = 38.2 cm/s Bearing vs Speed Differences for All Shared Radials Speed Differences (cm/s) Bearing (deg CCWE) R1 = /Users/garner/RADAR_GUIS/RadialEdits/CBBT/Radials From July2010 APM52deg smooth5/RDLm CBBT 2010 07 21 2100.ruv (879 count) R2 = /Users/garner/RADAR_GUIS/RadialEdits/CBBT/Radials From July2010 APM52deg smooth0/RDLm CBBT 2010 07 21 2100.ruv (849 count)
VIEW R1 Only: 18 count (red) R2 Only: 31 count (blue) Velocity Differences (R1-R2) for All Shared Radials: 368 count R1 slower (pink/red) R2 slower (cyan/blue) Darker shades > 30 cm/s Average Speed Difference = 3.4 cm/s Direction Changes (Subset of Shared Radials: 15 count) Average Speed Difference = 8.0 cm/s Bearing vs Speed Differences for All Shared Radials Speed Differences (cm/s) Bearing (deg CCWE) R1 = /Users/garner/RADAR_GUIS/RadialEdits/VIEW/VIEW smooth00/RDLm VIEW 2010 07 21 2100.ruv (386 count) R2 = /Users/garner/RADAR_GUIS/RadialEdits/VIEW/VIEW smooth05/RDLm VIEW 2010 07 21 2100.ruv (399 count)
Matlab GUI Scripts for QA/QC • Works with HFRADAR community toolbox HFR Progs • Display radial and/or total maps (can overlay plots) • Compute totals for a list of specifically chosen radials (LSQ method) • Edit a radial map by clicking on vectors to remove • Run a custom script that will edit radial files • Plot only the radials that contributed to a specific total vector • Compare two radial maps
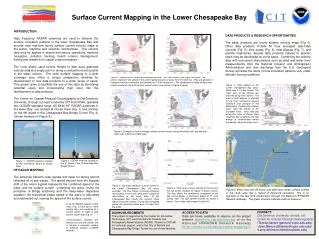
Data Access HFRADAR @ Old Dominion University http://www.ccpo.odu.edu/currentmapping Teresa Garner garner@ccpo.odu.edu 757-683-4816 HFRADAR surface current data in the lower Chesapeake Bay (April 2007-present) are available through ODU and the data may be transferred in a variety of formats (i.e. text, MAT files, NetCDF).
Acknowledgements • CIT, MACOORA, NOAA • CODAR support • HFRADAR operators
2.5 km Gridpoint Radial Current Velocities Around each grid point… Combine Radial Vectors (Least Squares Average) + Grid Total Current Velocities