Download
1 / 52
540 likes | 976 Views
Measuring Intelligence. (Spiral) Introduction to Intelligence KWL: . K : List 20 words that relate to intelligence. W: Read the “Review” on Myers pg. 415. For each of the five sections, come up with 2 intelligent questions about the terms, ideas, or theories presented in that section.

E N D
(Spiral) Introduction to Intelligence KWL: • K: List 20 words that relate to intelligence. • W: Read the “Review” on Myers pg. 415. For each of the five sections, come up with 2 intelligent questions about the terms, ideas, or theories presented in that section. • L: Listen and look for answers to your questions during the lecture.
Is intelligence one ability, or is it comprised of several, distinct abilities? • One core ability • Factor analysis: a statistical procedure that links underlying abilities together to form intelligence • Spearman’s g is general intelligence + spin offs • Brain anatomy and neural processing speed • A combination of several abilities • Sternberg’s three intelligence domains • Gardener’s eight “multiple intelligences” • Fluid and crystalized intelligence
Spearman and g • When? 1904 • Governing Principle: • Factor analysis: • Find correlations among many different mental abilities related to intelligence. Analyze them to find closely related clusters of abilities. • If several abilities correlate highly with each other, some mysterious single factor must be influencing them all. • This uniting factor, or core, is called g. • EX. Bob is good at spatial reasoning, memorizing equations, and French. The one factor that all of these aptitudes have in common is g, or “general intelligence.”
Spearman SPINOFFS! J.P. Guilford (1950’s) created his three-factor structure of the intellect, commonly known as SOI. In his cubic model there are three separate factors that make up any intellectual activity (see left). Louis Leon Thurstoneis known for the development of the Thurstone scale, which replaced Binet’s original scale. Came up with theory of Primary Mental Abilities" (PMAs), which were independent group factors of intelligence that different individuals possessed in varying degrees. He opposed the notion of a singular general intelligence that factored into the scores of all psychometric tests and was expressed as a mental age (see right)
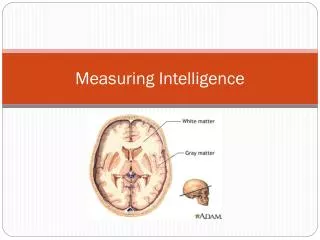
Brain Anatomy and Intelligence • MRI scans reveal a +.33 correlation between brain size (adjusted for body size) and intelligence score (Carey, 2007, McDaniel, 2005) • Correlation especially relevant to frontal and parietal lobes (Jung & Haier, 2007). • Childhood intelligence linked with patterns of thinning and thickening of the cortex. Kids who’s cortex thickness peak early (thus indicating a shorter developmental window) are less intelligent than kids who have a longer window of cortex development • Higher scores in adults linked with more gray matter (neural cell bodies) in areas involved in attention, memory, and language (Haier 2004; Colom et al., 2006). Is g centered physiologically in gray matter? See next slide • Correlation (+.3 to +.5) between perceptual speed and intelligence scores (Deary & Der, 2005; Sheppard & Vernon, 2008). • Famous brains: Lord Byron, Beethoven, Einstein
Grey Matter vs White Matter • http://www.indiana.edu/~p1013447/dictionary/greywhit.htm
Sternberg • When? 1985 • Cognitive Conceptualizations of Intelligence • Sternberg’s triarchic theory and successful intelligence • Triarchic Theory: • Contextual subtheory: behavior and culture • Experiential subtheory: reciprocal relationship between behavior and intelligence • Componential subtheory: cognitive processes that underlie intelligent behavior
Successful Intelligence (1999, 2000):(part of the Triarchic Theory; detailed offshoot of the Componential Subtheory and Performance Components)analytical intelligence:academic problem-solving assessed by intelligence tests, which present well-defined problems having a single right outcomes. Linked to grades and vocational success.creative intelligence: is demonstrated in reacting adaptively to novel situations and generating novel ideas.practical intelligence: required for everyday tasks, which may be ill-defined. Multiple solutions. EX. Managerial success (can you manage yourself, tasks, and other people?) Intelligent Behaviors Cognitive processes Figure9.20 Sternberg’s triarchic theory of intelligence Experiences and learning THE ONE TO MEMORIZE
Howard Gardner • When? 1983 • Gardner’s multiple intelligences • IQ tests emphasize verbal and mathematical skills and exclude other important skills. • General, descriptive theory of different “thinking styles” (compromises its validity in the scientific community because not oozing evidence). • Gardner’s research on the brain indicated that certain parts of the brain specialize in certain tasks. If one part of the brain is damaged, people can still perform tasks not involving the damaged part of the brain perfectly. • Gardner suggests the existence of a number of separate human intelligences • Logical-mathematical • Linguistic • Musical • Spatial • Bodily-kinesthetic • Interpersonal • Intrapersonal • Naturalist
What are fluid and crystallized intelligence? • Psychologist Raymond Cattell. The Cattell-Horn theory of fluid and crystallized intelligence suggests that intelligence is composed of a number of different abilities that interact and work together to produce overall individual intelligence. • Fluid intelligence is the ability to think and reason abstractly and solve problems. This ability is considered independent of learning, experience, and education. Examples of the use of fluid intelligence include solving puzzles and coming up with problem-solving strategies. • Crystallized intelligence is learning from past experiences and learning. Situations that require crystallized intelligence include reading comprehension and vocabulary exams. This type of intelligence is based upon facts and rooted in experiences. This type of intelligence becomes stronger as we age and accumulate new knowledge and understanding.
(Spiral) Famous Studies on Intelligence • Studies 13 (“What You Expect is What You Get”) and -14 (“Just How Are You Intelligent?”) • For each “Famous Study,” students should • (1) read the study completely, • (2) outline each subcategory of each article • introduction, • theoretical prop., • method, • results, • discussion, • sig. of findings/criticisms
Intelligence and Testing Focuses for this subunit: Intelligence Testing: standardization, validity, reliability IQ: history, equation, heritability (especially Scarr’s theory), ethnic studies, socioeconomic studies, cultural bias
(Spiral) “Assessing Intelligence” Outline (Module 34) Define OR describe each: • Binet’s mental age • Terman’s Stanford-Binet scale • Sterns’IQ formula • Achievement vs aptitude • Wechsler's WAIS IV • Principles of test construction • Standardization • The normal curve • The Flynn effect • Reliability • Validity • The extremes of intelligence (low and high) = shows up on at least one released exam
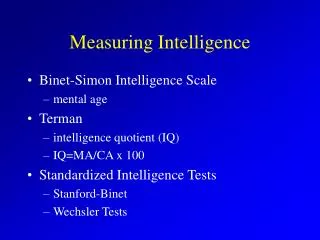
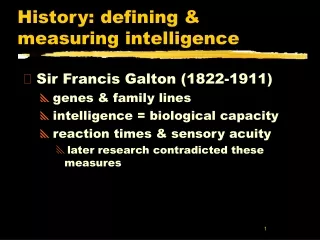
The Evolution of Intelligence Testing • Sir Francis Galton (1869) • Hereditary Genius: proposed that success runs in families because intelligence is inherited. Based on Darwin • Alfred Binet and Theodore Simon (1905) • Commissioned by the French government in 1904 to study the problem of children of newcomers to Paris being able to learn from a regular school curriculum. Basis for special-ed. • Binet-Simon Intelligence Scale: designed to single out youngsters in need of special training and alternate curriculum. • Mental age: EX. a 4 year-old child with a mental age of 6 performed like the average 6 year-old on the test. • Binet was eager to help children through the testing, but he feared that the test would be used to label children and limit their opportunities (Gould, 1981)
Verbal 1. Rearrange the following letters to make a word and choose the category in which it fits. RAPETEKA A. cityB. fruitC. birdD. vegetable 2. Find the answer that best completes the analogy people : democracy :: wealthy : A. oligarchyB. oligopolyC. plutocracyD. timocracyE. autocracy Mathematical/Spatial 3. Which number should come next in this series? 25,24,22,19,15 A. 4B. 5C. 10D. 14 4. Which diagram results from folding the diagram on the left?
The Evolution of Intelligence Testing • Binet’s fears were realized soon after his death in 1911, when others adapted his tests for use as a numerical measure of inherited intelligence. • Lewis Terman (1916) • Adapted Binet’s tests and re-normed them to test California school children. • Developed the Stanford-Binet Intelligence Scale, which doesn’t precisely measure IQ but something similar. • U.S. Government latched onto this idea and Terman promoted large-scale intelligence testing that would “ultimately result in curtailing the reproduction of feeble-mindedness and in the elimination of an enormous amount of crime, pauperism, and industrial inefficiency.” • New tests evaluated newly arriving immigrants and World War I army recruits. Only certain % of immigrants from the “dumber countries” aloud to immigrate to U.S. • German psychologist William Stern derived this formula from these tests: • Intelligence Quotient (IQ) = MA/CA x 100 • divides a child’s mental (MA) age by chronological age (CA) and multiplying by 100…this made it possible to compare children of different ages.
Modern Tests of Mental Abilities • Achievement tests (reflect what you have learned) vs • aptitude tests (predict your ability to learn a new skill. Ex. SAT is a “thinly disguised intelligence test (Garner, 1999). Aptitude intended to predict how well you’ll do in college. • David Wechsler (1955) • Wechsler Adult Intelligence Scale (WAIS IV). Also created a version of the test for school-aged children. Aptitude test, mostly, though has components of achievement test. • Doesn’t only yield a general intelligence score (like Stanford-Binet), but separate scores for verbal comprehension, perceptual organization, working memory, and processing speed. • give more emphasis to nonverbal reasoning, yielding a verbal IQ, a performance IQ, and a full-scale IQ. • devised a new scoring system based on the normal distribution…the deviation IQ. This scoring system is outlined on the next slide.
WAIS: Began development in the 30’s and surpassed Alfred-Binet test by the 60’s.
Are IQ Test Scores Stable Over a Lifetime? • Yes and no. • IQ scores are more likely to vary during critical developmental periods when a child is young. • As a child grows older, IQ test scores begin to stabilize (Bloom, 1964). • The pivotal age: 7 EX. Carla • Age 2: 120 • Age 4: 110 • Age 7: 115 • Age 10: 115 • Age 14: 115
Principles of Test Construction 1. Standardization: the uniform procedures used in the administration and scoring of a test. • Test norms: provide information about where a score on a psychological test ranks in relation to other scores on that test…allows a psychologist to determine how a person scores relative to other people. • Standardization group: the sample of people that the norms are based on. EX: PSAT results. What did they show you? EX: What about DBA? Is it standardized? Lets look at your class on Data Director! 2. Validity: the test measures what it is supposed to measure. **Are what you want to measure and the questions/tasks you put on the test correlated? EX: Would you use handwriting analysis to gauge a persons intelligence? • Content validity: Does a test cover a representative sample of the content taught? Non-statistical. EX. Does the SBA actually cover what we learned in class? • Construct validity: Does the test actually measure the psychological theory being studied. Statistics are used to evaluate. EX: Does an IQ test really measure “intelligence?” • Predictive validity: Does the test predict accurately the future result that it was designed to predict, such as a person succeeding in a specific arena? i.e. aptitude test • Reliability: consistency **Can the test results be reproduced? EX: You scored a 26 on the ACT. You take it again and score a 27. Were the results about the same?
Sample FRQ on Test Construction • Jorge takes the ACT three times. The first time, he gets a 23; the second time he gets a 24; the third time, he gets a 22. These test scores are mediocre, yet they’re consistent. Jorge then receives his Fall Semester report card. His cumulative GPA is a 3.9. Describe what’s going on in this situation in terms of the ACT’s reliability and validity. • ANSWER VERBALLY
Reliability and Validity of IQ tests • Exceptionally reliable – correlations into the .90s • Qualified validity – valid indicators of academic/verbal intelligence, not intelligence in a truly general sense • Correlations: • .40s–.50s with school success • .60s–.80s with number of years in school • Predictive of occupational attainment, debate about predictiveness of performance
(Spiral) Make Your Own Normal Curve • Write down 5-7 key points from the lecture. • The other part of this assignment will follow after the lecture (slide 35).
IQ Test • Normal distribution: statistical arrangement of scores so that they resemble a bell shape. The bell shape is where the majority of scores fall, the middle. **68% of people score within 15 points above or below 100. **95% of all people fall within 20 points of 100 **Top and bottom 2% are “gifted” or “intellectually disabled” (mentally retarded)
Mental Retardation/Intellectual Disability in IQ scores • 3 levels of Disability • Mild: IQ btwn. 50-70, can read and write, master simple skills, 85% of individuals with retardation fall into this category. • Moderate: IQ btwn. 33 to 55, can become partially independent, live in a self help setting. Can learn a basic vocation sometimes • Severe: IQ btwn. 20 to 40, 5% individuals fall into this category, need supervision their entire lives, but can learn a few simple skills, which allows them to work in very simple environments • Below 20: cannot learn much. Dependent on others for just about every taks • Mental retardation/intellectual disability is a substantial limitation on functioning that is characterized by significantly sub average intellectual functioning, along with related limitation in two of eleven areas, including communication, self-care, home living, social skills, academic skills, leisure, and safety (APA, 2000)
Gifted: IQ Scores • Moderately gifted is usually defined by IQ score btwn. 130-150; a profoundly gifted child has IQ score 180 or above. • EXAMPLE: ShoYano, IQ is 200. Began Ph.D.-M.D. studies in California at age 12. • 1921 Terman’s study of children with IQ scores over 135 indicated showed that many gifted children were well-adjusted and attained high levels of education. More recent studies confirm this. • Critics of gifted programs points out that treated kids as gifted produces a self-fulfilling prophecy (see Rosenthal), but the kids aren’t necessarily any smarter. Also, poor and minority kids are often placed in deprived environments. Jean Piaget
Gifted: IQ Scores On the other hand: • How do gifted children turn out? (Terman & Oden, 1959) • 1500 gifted children were tracked over 65 years. • 30% never finished college • 2% flunked out of college • 9% had emotional issues • 7% committed suicide **Brain areas responsible for higher cognitive reasoning develop differently in highly intelligent children. (Shaw, 2006) **The moral of the story: While gifted kids’ minds work differently, they are not necessarily socially maladjusted and their outcomes are not necessarily different from those of non-gifted children. That depends on a lot of factors.
IQ Scores • Do IQ scores predict job performance? • Not accurate at predicting specific job performance, but does have a moderate correlation • Do IQ scores predict academic achievement? • IQ test measure similar abilities to those in academic settings • There are some, medium, association between IQ and grades. **Other factors of success include personal characteristics, interest in school & willingness to study
Fun Facts from “Assessing Intelligence” • Choose 3 facts that stood out to you personally regarding traditional and modern theories of intelligence. Use them in the discussion (review both traditional and modern theories and especially testing norms).
(Spiral) Make Your Own Normal Curve: • Using pg. 420 as a guide, make a normal curve with the following data set: • Your standard deviation is 10. • Your mean is 50. • What percentage of students taking this verbal aptitude test will score between 40 and 70? • See next page for answer.
Answer is 82%. • Why? • 34+34+13.5=81.5 • Now, make your OWN normal curve. Set up a testing situation, draw a curve, come up with a mean, a standard deviation, and a question. Then, answer it!
Variance • What is it? • (1) A measure of the average distance between each of a set of data points and their mean value. • (2) It is also equal to the sum of the squares of the deviation from the mean value. • Why am I telling you this? • If they give you a “variance” and ask you what the “standard deviation” is, take the square root of the variance to find it. • If they give you a “standard deviation” and ask you what the “variance” is, square the standard deviation. • EX. Variance=100, sd=10 • EX. Variance=36, sd= ___ • EX. sd=7, variance=49 • EX. sd=12, variance=____
Nature vs Nurture: Do We Inherit Intelligence?Read the following results from multiple studies over the years. Does nature or nurture tend to win out? In Myers pgs.428-9. • Nature • Twin Studies (100 of them) show that intelligence correlation for identical twins reared together is .86 • Identical twins reared apart is still over a .7 correlation, which is high. • Identical twins have similar gray matter volume (Thompson et al., 2001) • Specific genes pinpoint variations in intelligence and learning disabilities (Myers, 428) • Intelligence scores of adoptive siblings reared together is a moderate correlation of .32 • Higher correlations between identical twins raised apart than for fraternal twins raised together. • Adopted children’s intelligence greater resembles biological parents; not adoptive parents • Nurture • Adoption studies show that adopted children resemble adoptive parents’ IQ somewhat, because adoptive parents shape children’s environment (Locurto, 1990; Loehlin, Horn, & Willerman, 1997). • Unrelated children who are raised in the same home also show a significant resemblance in IQ (Locurto, 1990; Loehlin, Horn, & Willerman, 1997). • Cumulative deprivation hypothesis true (children raised in substandard circumstances would experience a gradual decline in IQ as they grow older since other children will be progressing more rapidly, e.g. chronological age can keep up with mental age). See examples from Appalachia and poor kids being adopted by rich families. • School attendance has positive correlation with IQ (Ceci and Williams, 1997) • The Flynn Effect (IQ’s increasing with better education, nutrition, and technology) • With a partner, prepare a one-sentence statement that explains the relationship between nature and nurture regarding intelligence in a nutshell.
“The Interaction of Heredity and Environment” • 1991 • Sandra Scarr’s (et. al) “interactionist” theory about “reaction ranges” explains how genetics and upbringing interact to produce intelligence. • “heredity may set certain limits on intelligence and environmental factors determine where individuals fall within these limits” (Weiten, 361) Wee Activity EX. John was born and raised in a deprived environment. His genetically-predisposed IQ range is 110-125. Where will he likely score on an IQ test? EX. Susan was born and raised in an enriching environment. She attends school, works hard, and sets high goals for herself. Her genetically-predisposed IQ range is 90-105. Where will she likely score on an IQ test? EX. Susan’s identical twin, Pam, was born and raised in the same environment as Susan. Pam misses school frequently, does as little as possible, and is indifferent about her future. Where will she likely score on an IQ test?
Group Differences in IQ Scores A Socially-Charged Dimension of the Nature vs Nurture Debate
“Although the full range of IQ scores is seen in all ethnic groups, the average IQ for many of the larger minority groups in the United States (such as African Americans, Native Americans, and Hispanics) is somewhat lower than the average for whites. The disparity ranges from 3 to 15 points” (Weiten, 361-362). • “If there were no group differences in aptitude scores, psychologists could politely debate hereditary and environmental influences in their ivory towers. But there are group differences. What are they? And what shall we make of them” (Myers, 432)? • “The bell curve for Whites is centered roughly around IQ 100; the bell curve for American Blacks roughly around 85; and those for different subgroups of Hispanics roughly midway between those for Whites and Blacks” (Avery et al, 1994).
(Spiral) Group Differences Jigsaw • Group #1: Read “Gender Similarities and Differences” (Myers, 432). In which areas of assessment do men and women differ and why? • Group #2: Read “Ethnic Similarities and Differences” (Myers, 435). How and why do scores vary among people of different ethnic backgrounds? Name at least 3 examples. What are the exceptions? • Group #3: Read “The Question of Bias” (Myers, 438). What kinds of biases do we see in testing and how do they happen? Also, explain stereotype threat.
Guide to “Group Difference” • Gender • Women surpass men in verbal, computational skills, and general intelligence, but only slightly. • Women surpass men to a greater degree in emotional intelligence. • Men surpass women to a greater degree mathematical problem solving and spatial ability. • Notable gender differences are seen in the extremely high end and low ends of the bell curve. For example, when males and females who have extreme mathematical aptitudes compete, men outnumber women greatly. • Males’ scores vary more than females’ scores. • Reasons: • (1) evolutionary gender tasks require male spatial reasoning , • (2) the male exposure to specific hormones in the womb enhance spatial/problem solving ability, and • (3) the different patterns of socialization of boys and girls and resulting social expectations. • Source: Myers
Guide to “Group Differences,”Ctd. • Ethnicity: • “The bell curve for Whites is centered roughly around IQ 100; the bell curve fro American Blacks roughly around 85; and those for different subgroups of Hispanics roughly midway between those for Whites and Blacks” (Avery et al., 1994) • The Black-White difference has diminished somewhat in past years (Dickens & Flynn, 2006). • New Zealanders of European descent outscore native Maori New Zealanders. Israeli Jews outscore Israeli Arabs. Most Japanese outscore the minority Burakumin. Hearing people outscore deaf people (Braden, 1994; Steele, 1990), Zeidner, 1990) • Yet, “millions of Blacks have higher IQs than the average White” (Murray and Herrnstein, 1994). So, do group difference provide a basis for judging individuals? • Why? • The world has differing climates and survival challenges (many research studies). • Environmental determinants of heritable traits. EX. Give hearing children, who grew up hearing the testing language, a test based in that language. Give deaf children, who grew up speaking a different language, the same test. Hearing children will score higher. • Genetics research that indicates that races are almost alike in genetics. Indeed, Europeans and dark-skinned Africans are more genetically similar than are dark-skinned African and the dark-skinned aborigines of Australia.
Guide to “Group Difference” Ctd. • Race is not neatly defined biological category. Is race really biological or is it just social? So why segregate test scores by race? • Asians outscore Americans on math achievement and aptitude tests. However, this is a recent phenomenon, and it may be due to cultural differences and the fact that Asian students attend school 30% more time. • Research shows that nutrition and educational culture have always impacted intelligence and that today’s test scores may point to socioeconomic differences between Caucasian and African Americans. • Caucasian and African American infants score equally well on intelligence tests. • When Caucasians and African Americans are exposed to the same knowledge, test scores on information-processing are comparable. • In different eras, different ethnic groups have experienced golden ages, so how can certain races be biologically inferior to others. When western Europeans were still swinging from trees, Northern African and Persian societies were blossoming in science and literature. • The achievement gap between Caucasian and African Americans increase in high school, but it narrows again in college. This may be due to unequal environments in high school (you have to go to the high school in which you are districted), but college environments are of more comparable quality (you end up going to UNM, just like the kid who graduated from the Albuquerque Academy).
Guide to “Group Difference” Ctd. • Socioeconomic • Minorities have depressed IQ scores b/c children grow up in “deprived” environments that create a disadvantage- in school and in IQ. • In general, white people and minorities grow up in very different circumstances. • Minority groups have a history of “economic discrimination” • Lower-class children likely to come from larger families=disadvantage in parental assistance. • Poorer role models and language poverty. • Poorer exposure to books. • Less pressure to work hard on intellectual pursuits. • Poorer schools. • Malnutrition. • Stereotype vulnerability: Minorities have the added pressure that, if they fail, others will attribute that failure to their race or sex. This undermines emotional investment in the IQ task.
The Question of Bias • Are aptitude tests biased in that they are sensitive to performance differences caused by cultural experience? • What’s “bias?” • In the usual sense, it means that the test measures your developed abilities as reflected by your education and abilities. BIAS DOES EXIST IN THIS SENSE. • In Psychology, it means that a test predicts less accurately for one group than for another (predictive validity). PSYCHOLOGISTS CONSIDER MOST APTITUDE TESTS “UNBIASED.” • When bias does exist, it takes the form of . . . • Stereotype threat or stereotype vulnerability: a self-confirming concern that one will be evaluated based on a negative stereotype. This fear causes the subject to score lower on intelligence tests.
(Spiral) The Question of Bias • Read through the section on “The Question of Bias” (Myers pgs. 438-440). Then finish the ending of each scenario. Then explain why each scenario would end in such a way using the terms and concepts from your reading. Here’s are the situations.
Scenario 1: • You are the son of Honduran immigrants. You attend a low class high school. You know your school is under “restructuring” from the State. You’ve heard from fellow students that your school has such test scores because of its “ESL problem.” You know that ESL refers to people who are trying to learn English, like you. You’ve also watched frequent news reports about crime that has happened within your school’s boundaries. Your brother just took the ACT. He scored a 21. His buddies ridiculed him for “trying to be an American.” You want to go to college, too. You sit down to take the ACT.
Scenario 2: • You are the son of Honduran immigrants. You attend an upper class high school. Your school is new, and there’s an energetic feeling in the air. Your parents are uneducated themselves, but they want you to “make something of yourself,” so they have made you read a book in English every night since you were six years old. Many of your friends are Hispanic, and they live in your neighborhood. Sometimes you get together with them and study, and sometimes you just hang out. One day at lunch, a group of you is talking about taking the ACT. You go to the counseling office and sign up. Since you all want to go to college together, you help each other study. The day of the test arrives. You sit down to take it.