Download
1 / 35
360 likes | 828 Views
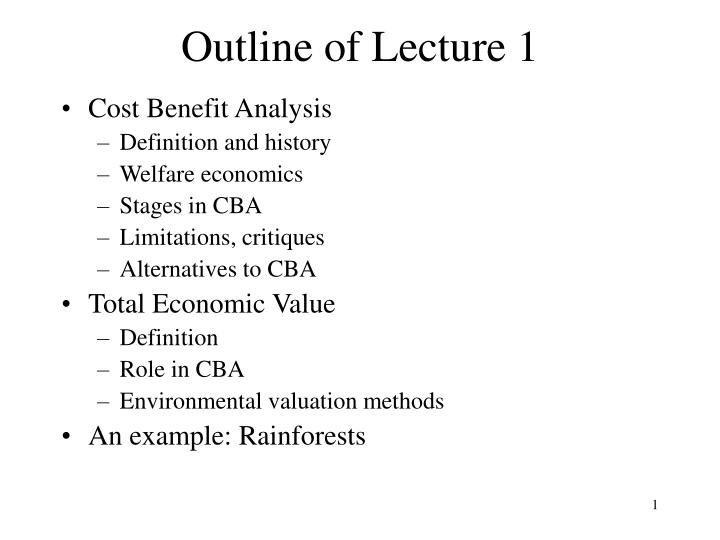
Outline of Lecture 1. Cost Benefit Analysis Definition and history Welfare economics Stages in CBA Limitations, critiques Alternatives to CBA Total Economic Value Definition Role in CBA Environmental valuation methods An example: Rainforests. Cost Benefits Analysis (CBA).

E N D
Outline of Lecture 1 • Cost Benefit Analysis • Definition and history • Welfare economics • Stages in CBA • Limitations, critiques • Alternatives to CBA • Total Economic Value • Definition • Role in CBA • Environmental valuation methods • An example: Rainforests
Cost Benefits Analysis (CBA) • Benefit Cost Analysis (BCA) is an economic tool for government policy and investment project analysis used widely • Can incorporate environmental impacts of policies/projects within CBA to correct for market failure • “Social” appraisal of policies and projects, carried out by aggregation of benefits from, and costs of a policy/project over individuals and over time • Welfare theoretic underpinning: Economic efficiency with a temporal dimension
Cost Benefit Analysis • Relates to the environment in three ways: • Projects/policies may have negative environmental effects, i.e. negative externalities (public and private) • Projects/policies may have positive externalities (public) • Projects/policies may have both positive and negative externalities (public and private) • Externalities should be included in CBA in order to correct for market failure
History of CBA- USA • 1808 Comparing costs and benefits of water related projects • Until 1960s mainly used in water resources management • 1960 onwards expanded to other public goods (wildlife, air quality) • Since 1970s CBA is required to support environmental decisions.
History of CBA-UK • 1960s-1970s CBA used in transportation (M1 Motorway, London Victoria Underground, Channel Tunnel, Third London airport) • 1990 UK Pearce Report recommended that environmental impacts should be brought to formal policy and project appraisal where possible A government’s policies can affect the environment from street corner to stratosphere. Yet environmental costs and benefits have not been integrated into government policy assessments, and sometimes they have been forgotten entirely. Proper consideration of these effects will improve the quality of policy making.
History of CBA-UK • Report affected several policies in the UK since 1990s (landfill tax, national air quality standards, agri-environmental policies, etc.) • CBA also used in project appraisal with environmental impacts (investment in coastal defences, water quality improvements, inclusion of biodiversity values in forest return calculations, etc.)
History of CBA-EU • Used widely in some European countries (e.g. Sweden, Netherlands, Austria) but not so widely in others (e.g. Germany, Italy, Ireland) • Until 1990s many EU environmental directives issued without considering CBA and imposed costs on member states in excess of benefits (e.g. Bathing Waters Directive, Packaging and Packaging Waste Directive, Drinking Water Directive) • Recently the EU have considered CBA in several EU policies (e.g. directive on air pollution from municipal waste incinerators, Water Framework Directive)
Welfare Economics Background • CBA is firmly based in welfare theory in three ways • In terms of how gains and losses are measured • Consumers: Changes in consumer surplus as a result of changes in quantity and quality of environmental goods • Producers: Changes in producer surplus as a result of changes in prices and quantity and quality of inputs • Makes use of the opportunity cost (scarcity rents) concept to asses costs of using scarce resources
Welfare Economics Background 2. What counts as costs and benefits • Welfare economics evaluates alternative resource allocations in terms of their effects on utility • CBA includes any impact on utility whether or not they are reflected in market prices
Welfare Economics Background 3. In terms of aggregation and comparison of costs and benefits • Policies and projects have a mixture of gains and losses across individuals • Gains and losses are calculated in money terms, added up and compared to find out the net impact on welfare (net gain or net loss) • Measure of the change in social welfare is based on Kaldor-Hick Criterion: Could gainers compensate the losers and still be better off? • This criterion considers economic efficiency but interpersonal welfare impacts, i.e.distribution of gains and losses are not considered
Stages of CBA • Stage 1: Definition of policy/project: • The reallocation of resources being proposed • The population of gainers and losers being considered • Stage 2: Identification of policy/project impacts: • Define all impacts that will result from policy/project implementation • Consider additionality (net impacts) and displacement (crowding out)
Stages of CBA • Stage 3: Identification of economically relevant impacts: Environmental impacts of a policy/project are relevant in CBA if either • They change the utility of at least one person in the society • They change the quantity or quality of the output of some positively valued commodity
Stages of CBA Stage 4: Physical quantification of relevant impacts: • Determine physical amounts of costs and benefits and when they occur in time • Use environmental impact analysis to estimate the impact of policy/project on the environment • Estimations will be made with uncertainty, calculate the expected value of costs and benefits
Stages of CBA • Stage 5: Monetary valuation of relevant effects • All physical measures of impacts should be valued in common units to be comparable • Common unit = money • CBA analyst must • Predict prices for value flows extending into the future • Correct market prices where they are distorted • Calculate prices where non exists using environmental valuation methods
Stages of CBA Stage 6: Discounting of costs and benefits: • Once costs and benefits are expressed in monetary units they should be converted to present value terms by discounting • PV= Xt[(1+r)-t] where X= cost or benefit; r = discount rate; [(1+r)-t] discount factor; t= time • The higher the value of t the lower the discount factor • The higher the discount rate for a given t the lower the discount factor
Stages of CBA • Stage 7:Applying the net present value test: • Apply NPV test to choose those policies and projects that are efficient in terms of their use of resources • Where Bt = benefits of the project at period t, Ct = the costs of the project at period t, r = the discount rate, n = the number of years over which the project will operate • NPV is the present value of the project’s/policy’s net benefit stream, obtained by discounting the stream of net benefits produced by the project/policy over its lifetime, back to its value in the chosen base period, usually the present. • If NPV>0 accept policy or project (Based in Kaldor-Hicks Criterion) since it would improve social welfare
Stages of CBA • Alternatives to NPV • Benefit – Cost ratio (BCR): It is the ratio of the sum of the project’s or policy’s discounted benefits to the sum of its discounted costs. If BCR>1 go ahead with the project/policy
Stages of CBA 2. Internal Rate of Return (IRR): Rate of interest which if used as the discount rate for a project/policy, would yield a NPV of zero. It is the discount rate at which it would be just worthwhile doing the project/policy. So the IRR is the discount rate, r*, at which: However IRR is a flawed measure of resources allocation because many projects/policies generate multiple IRRs and also because it cannot be used to compare projects/policies.
Stages of CBA • Optional addition to stage 7 • Change weights in the NPV function since income distribution is not equal benefits and costs are not distributed equally across society • Conventional NPV puts equal weights on each individual • Weights can be adjusted by wi=Y*/Yi, where Y* is household income across all groups, Yi is mean income in group i and wi is the weight attached to impacts on i, • This gives higher weight to poorer groups and the NPV becomes NPV= w1B1+w2B2+…..+wn Bn , where Bi is the discounted net benefits to group i • This procedure is rarely used except in developing countries
Stages of CBA • Stage 8: Sensitivity analysis: • NPV test gives relative efficiency of a project given the data on prices, environmental and economic impacts and discount rate but any of these data might change due to uncertainty • Recalculate NPV when the key parameters change to discover which one(s) of them the NPV is most sensitive to • Once the most sensitive parameter is identified direct forecasting effort to improve best guess and more effort to manage these parameters carefully
Limitations of CBA • Valuation of environmental goods • Ecosystem complexity • Discounting and discount rate • Institutional capture • Sustainability and CBA
Alternatives to CBA • Environmental impact assessment (EIA) • Cost-effectiveness analysis (CEA) • Multi-criteria decision-making (MCDM) • Cost-utility approach • Risk-benefit approaches
Recap on CBA • CBA is well-established component of applied welfare economics and of public policy and project analysis • Include environmental impacts in CBA to make more efficient decision making and to explicitly recognise the impact of economy on the environment and the contribution the environment makes to utility and economy • Including the environment in the CBA does not mean the environment will be conserved since CBA makes trade-offs between the environment and other resources. • CBA is concerned with efficiency but generally not compatible with sustainable development wrt inter and intra generational fairness
Total Economic Value (TEV) • Environmental goods are public goods, they are not traded in the markets and hence they do not have readily available market prices • The value of environmental good is not only derived from its direct consumption but also from its indirect consumption, as well as non-use. • The broad concept of value is known as the Total Economic Value (TEV)
Environmental Valuation Methods • Indirect approaches/Revealed Preference Methods: • Hedonic Pricing Method • Travel Cost Method • Dose -Response Functions • Averting Behaviour • Market Prices • Direct approaches/Stated Preference Methods: • Contingent Valuation Method • Attribute Based Choice Modelling • Choice Experiments • Paired Comparisons • Contingent Ranking • Contingent Rating
TEV Example: Tropical Deforestation • Tropical forests are declining in area by 0.8% per year. • TEV of that amount is lost • Forest lost is due to • Population growth • Market failure • Government failure
TEV Example: Tropical Deforestation $ MNPBD+SUB MNPBD MECL+G MECL N A B C D forest loss • MNPBD = the marginal net development benefits from converting the forest to, say, agriculture • MNPBD+SUB = marginal net development benefits including subsidies to convert the land • MECL = marginal external costs borne locally from forest conversion • MECL+G = marginal external costs borne locally and by rest of world from forest conversion • Note that MEC is measured by the total economic value of the forest services that are lost.
TEV Example: Tropical Deforestation • There are 4 points of interest. • C = local private optimum, i.e. all externalities are disregarded. There are no subsidies. • D = local private optimum , i.e. all externalities are disregarded and forest conversion is subsidised • B = local social optimum, i.e. local externalities are internalised but global externalities are ignored • A = global social optimum, i.e. all externalities are internalised. • Assuming a global view is taken, the desirable position is A.
TEV Example: Tropical Deforestation • CD: Government failure, i.e. the amount of forest land that is lost due to government subsidies to conversion. • BC: Local market failure • AB: Global market failure by • AD: Amount of forest conversion that takes place inefficiently. • OA: Efficient conversion. • Population growth also increases rates of forest loss by increasing the demand for 'developmental' benefits, e.g. land for food. • This causal analysis shows us how to think about policy. To 'save' the forests we need: • to reduce population growth • internalise local externalities • internalise global externalities • remove subsidies to forest conversion
TEV Example: Tropical Deforestation • Direct use values: Timber values, fuelwood and charcoal extraction, non-timber forest products (NTFP), biodiversity and genetic information, tourism and recreational values. • Indirect use values: Protection of watersheds and the storage of carbon and sequestration. • Option values: values reflecting a willingness to pay to conserve the option of making use of the forest even though no current use is made of it • Non-use values (also known as existence or passive use values): these values reflect a willingness to pay for the forest in a conserved or sustainable use state, but the willingness to pay is unrelated to current or planned use of the forest.
TEV Example: Tropical Deforestation CBA on forest conservation. • Converting primary forest to any use other than agroforestry or very high value timber extraction fails CBA. • Converting secondary forest to the 'cycle' of logging, crops and ranching could make economic sense but many conversions to slash and burn agriculture would make no economic sense. • Converting secondary forest and open forest to agroforestry appears to make economic sense, assuming that most of the forest's services (including biodiversity) are retained. • Non-market values almost certainly fail to capture the economic value of biodiversity which, apart from the value of genetic information, is omitted from the analysis. • Carbon storage is of the utmost importance to the economic case for forest conservation.
Recap on TEV • Values of environmental goods are complex because • They are public goods • They do not have market prices • People derive values other than consumption benefits from them • Value of an environmental good is broad TEV= (Direct use value+Indirect use value+Option Value) +(Bequest Value+Altruistic Value+Bequest Value) • TEV should be estimated using environmental valuation methods • TEV should be included in CBA in order to ensure efficient provision/conservation of environmental goods