Download
1 / 30
300 likes | 406 Views
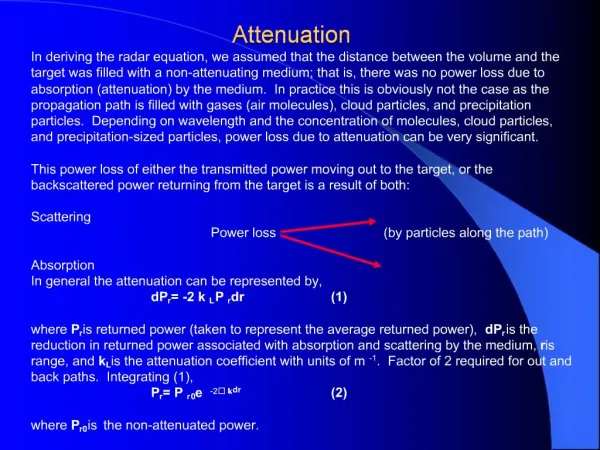
More observations of attenuation under the NK test site David Jepsen and Marthijn de Kool, Australia Previous work Direct comparison of observed spectra from historical test sites and NK Signs of local structure in attenuation Some results from the P/ pP spectral ratio method.

E N D
More observations of attenuation under the NK test site • David Jepsen and Marthijn de Kool, Australia • Previous work • Direct comparison of observed spectra from historical test sites and NK • Signs of local structure in attenuation • Some results from the P/pP spectral ratio method
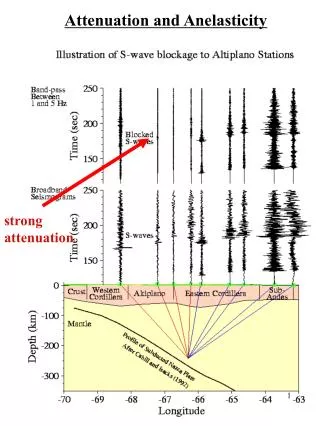
Previous work on NK test site attenuation • From the very beginning, there have been varying opinions on the amount of attenuation (t* value) • Fitting teleseismic spectra with attenuated semi-empirical source spectra (Mueller-Murphy) tends to find a higher t* than typically associated with Kazakhstan • Some claims of very high frequencies observed on individual teleseismic array elements (NVAR) (-> low t*) • Velocity models from the literature for this region are not conclusive • Using deep earthquakes in the region (Ichinose et al.) found low local (upwards) t* from fitting an attenuation model to local and teleseismic spectra. However, using the pP/P spectral ratio method a high local t* is found • Need for observations that are as direct as possible, to avoid having to rely on modelling assumptions
At our previous meeting we showed this spectral comparison of NK2009 with a known-yield (8kt) Degelen test. The NK test spectra appear to fall of more steeply, indicating higher attenuation.
New spectral comparisons for a range of test sites NTS EKA NORSAR FINESA DPRK STS
NORSAR dataset STSNTS 1971145 5.05 Degelen 1973157 6.1 Pahute Mesa 1972088 5.18 Degelen 1975134 6.0 Pahute Mesa 1972299 5.19 Degelen 1975170 6.1 Pahute Mesa 1983102 4.65 Degelen 1975301 6.4 Pahute Mesa 1983333 5.31 Degelen 1975324 6.0 Pahute Mesa 1984253 4.89 Degelen 1976003 6.0 Pahute Mesa 1985122 5.7 Pahute Mesa 1971181 4.94 Balapan 1986198 5.7 Pahute Mesa 1976112 4.94 Balapan 1986273 5.6 Pahute Mesa 1976161 5.07 Balapan 1974058 5.8 Yucca Flat 1984152 5.8 Yucca Flat 1986318 5.8 Yucca Flat DPRK 1988287 5.9 Yucca Flat 2013043 4.93 P’unggye
NOA displacement response ELEM2 ELEM1 BB
sample spectra STS-D 1972088 mb5.18 NTS-PM 1973157 mb6.1 NTS-Y 1986318 mb5.8 STS-B 1976161 mb5.07
STS - NOA spectra Degelen- green Balapan - blue
NTS - NOA spectra Yucca – black Pahute Mesa (70s) – brown Pahute Mesa (80s->) - orange
ALL- NOA spectra Yucca – black Pahute Mesa (70s) – brown Pahute Mesa (80s->) – orange Degelen – green Balapan – blue DPRK2013 - red
ALL - NOA spectra (averages) Yucca – black Pahute Mesa (70s) – brown Pahute Mesa (80s->) – orange Degelen – green Balapan – blue DPRK2013 - red
ALL - NOA spectra (averages scaled) Yucca – black Pahute Mesa (70s) – brown Pahute Mesa (80s->) – orange Degelen – green Balapan – blue DPRK2013 - red
ALL - NOA spectra (averages scaled) Yucca – black Pahute Mesa (70s) – brown Pahute Mesa (80s->) – orange Degelen – green Balapan – blue DPRK2013 - red
C dataset STSNTS 1983102 4.65 Degelen 1983350 5.2 Yucca Flat 1988113 4.9 Degelen 1984046 5.1 Rainer Mesa 1988166 4.8 Balapan 1984350 5.4 Pahute Mesa 1989048 5.0 Degelen 1985082 5.3 Yucca Flat DPRK 2013043 4.93 P’unggye
sample spectra STS-D 1983102 mb4.65 NTS-Y 1983350 mb5.2 NTS-Y 1985082 mb5.3 STS-D 1988113 mb4.9
ALL - C spectra NTS – black STS - green DPRK - red
ALL - C spectra (averages) NTS – black STS - green DPRK - red
ALL - C spectra (averages scaled) NTS – black STS - green DPRK - red
ALL - C spectra (averages scaled) NTS – black STS - green DPRK - red
ALL - I spectra (averages scaled) NTS – black STS - green DPRK - red
Summary – spectral comparisons NOA C I
Deep earthquake spectra and local structure in attenuation under North Korea
Deep earthquake spectra at USRK above the source (blue), are not strongly attenuated (t* ~ 0.07-0.1). USRK attenuation is only slightly less than observed for teleseismic spectra. How is this compatible with NK test spectra results?
Compare average spectra of a set of deep EQs at KSRS and USRK: There is a large difference in attenuation between the paths to USRK and KSRS. The path to KSRS, passing under the test site, has a t* 0.15 higher than the path to USRK
Are responses OK ? • Slope of noise seems reasonable • Direct comparison with noise level suggest USRK has much smaller attenuation USA0B KS31
Results for deep earthquake pP/P ratio (method following Ichinose et al.) (t* difference in P and pP path is two times t*up)
Results not clear for all teleseismic observations (P coda still overlaps with pP), generally consistent with high local attenuation
Conclusion • Direct spectral comparisons of DPRK, STS and NTS tests show DPRK spectral slope more similar to NTS than STS • Evidence for attenuation structure under North Korea • These two results suggest that the yield of the DPRK tests could be a factor of 2 higher than previous estimated based of STS magnitude-yield relationship