Download
1 / 15
160 likes | 292 Views
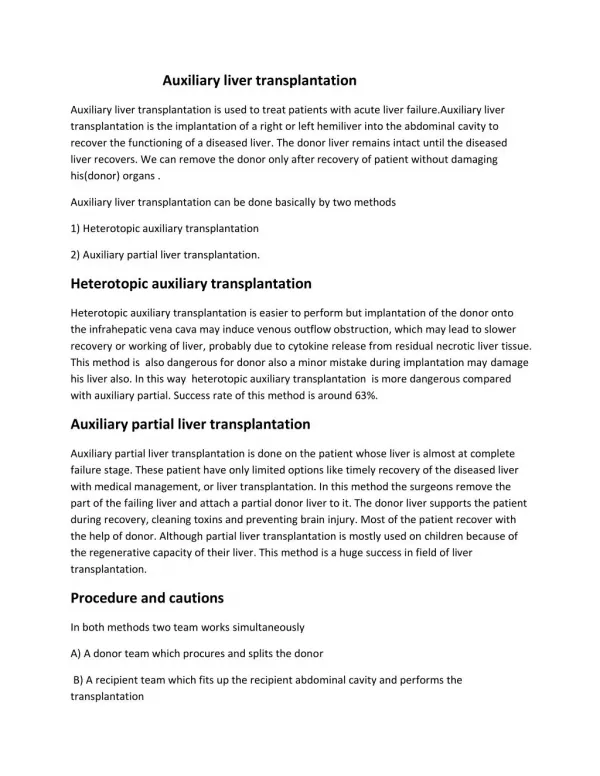
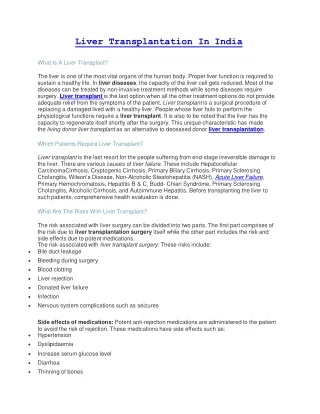
CHAPTER 4 LIVER TRANSPLANTATION. Editors: Dr Ganesalingam A/L Kanagasabai Expert panel: Dr Ganesalingam A/L Kanagasabai (Chairperson) Professor Dr Lee Way Seah Dr Lim Chooi Bee Dr Lim Kin Foong Dr Haniza Binti Omar. New patients. Alive at 31st Dec. 60. 55. 50. 45. 40. 35.

E N D
CHAPTER 4LIVER TRANSPLANTATION Editors: Dr Ganesalingam A/L Kanagasabai Expert panel: Dr Ganesalingam A/L Kanagasabai (Chairperson) Professor Dr Lee Way Seah Dr Lim Chooi Bee Dr Lim Kin Foong Dr Haniza Binti Omar
New patients Alive at 31st Dec 60 55 50 45 40 35 Number of patients (n) 30 25 20 15 10 5 0 1993 1995 1997 1999 2001 2003 2005 2007 1994 1996 1998 2000 2002 2004 2006 2008 Year Table 4.1.1 Stock and Flow of Liver Transplantation, 1993-2008 *1 patient who was alive until 05/12/1997 is recorded dead with missing date of death ** 1 patient transplanted in 2003 is recorded as dead with missing date of death Figure 4.1.1 Stock and Flow of Liver Transplantation, 1993-2008
Table 4.1.2 Distribution of Patients by Place of Transplant, 1993-2008 Table 4.1.3 Distribution of Patients by Centres for Liver Transplantation, 1993-2008
Male Female 10 8 6 Number of patients (n) 4 2 0 1993 1995 1997 1999 2001 2003 2005 2007 1994 1996 1998 2000 2002 2004 2006 2008 Year Table 4.2.1 Distribution of Patients by Gender, 1993-2008 Figure 4.2.1 Distribution of Patients by Gender, 1993-2008
Malay Chinese Indian Others 12 10 8 Number of patients (n) 6 4 2 0 1993 1995 1997 1999 2001 2003 2005 2007 1994 1996 1998 2000 2002 2004 2006 2008 Year Table 4.2.2 Distribution of Patients by Ethnic Group, 1993-2008 Figure 4.2.2 Distribution of Patients by Ethnic Group, 1993-2008
Table 4.2.4 Primary Diagnosis, 1993-2008 (N=100) ** 7 patients have more than one primary disease
Table 4.2.5 Indication for Transplantation, 1993-2008 (N=100) **33 patients had 1 indication for transplant, 63 had more than 1 indication for transplantation
Table 4.3.1 Distribution of Patients by Type of Donors, 1993-2008
Table 4.3.2 Immunosuppresive Drug Treatment at Transplantation, 1993-2008 (N=100) Note: 22 patients had 1 type if drug, 41 patients had 2 types, 23 patients had 3 types.
Patient Survival by Transplant Year 1.00 0.75 0.50 0.25 0.00 0 2 4 6 8 10 12 Duration in months Year 1993-1998 Year 1999-2008 Table 4.4.1 Patient Survival by Year of Transplant, 1993-2008 (N=100) Figure 4.4.1 Patient Survival by Year of Transplant, 1993-2008
Patient Survival by Gender 1.00 0.75 Cumulative Survival 0.50 0.25 0.00 0 2 4 6 8 10 12 Duration in months Male Female Table 4.4.2 Patient Survival by Gender, 1993-2008 (N=100) Figure 4.4.2 Patient Survival by Gender, 1993-2008
Patient Survival by Age Group 1.00 0.75 Cumulative Survival 0.50 0.25 0.00 0 2 4 6 8 10 12 Duration in months 0-9 years ≥10 years Table 4.4.3 Patient Survival by Age Group, 1993-2008 (N=100) Figure 4.4.3 Patient Survival by Age Group, 1993-2008
Table 4.4.4 Distribution of Patients by Cause of Death, 1993-2008 (N=100)