Download
1 / 78
790 likes | 978 Views
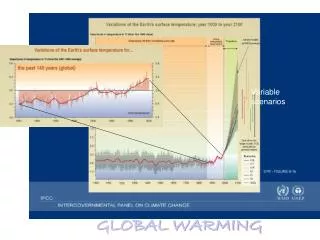
What is global warming about ?. Variations of the Earth’s surface temperature for the past 140 years. SPM 1a. Variations of the Earth’s surface temperature for the past 1,000 years. SPM 1b. Concentration of Carbon Dioxide and Methane Have Risen Greatly Since Pre-Industrial Times.

E N D
Variations of the Earth’s surface temperature for the past 140 years SPM 1a
Variations of the Earth’s surface temperature for the past 1,000 years SPM 1b
Concentration of Carbon Dioxide and Methane Have Risen Greatly Since Pre-Industrial Times Carbon dioxide: 33% rise Methane: 100% rise BW 5 The MetOffice. Hadley Center for Climate Prediction and Research.
700 The last 160,000 years (from ice cores) and the next 100 years CO2 in 2100 (with business as usual) 600 Double pre-industrial CO2 Time (thousands of years) 500 Lowest possible CO2 stabilisation level by 2100 400 CO2 concentration (ppmv) CO2 now 300 10 Temperature difference from now °C 200 0 –10 100 160 120 80 40 Now
Global warming enhanced by emissions of man-made gases Source: “Climate Change, State of Knowledge,” OSTP, 1997
General Findings from WGII • Temperature increases have already affected physical and biological systems • Preliminary indications that human systems have been affected by increases in floods and droughts • Natural systems are vulnerable and some will be irreversibly damaged • Many human systems are sensitive to climate change and some are vulnerable • Projected changes in climate extremes could have major consequences • Risks of large-scale and possibly irreversible impactsare yet to be reliably quantified • Adaptation is a necessary complement to mitigation • Those with least resources have least capacity to adapt and are most vulnerable • Adaptation, sustainable development, and enhancement of equity can be mutually reinforcing.
The world has grown dependent on inexpensive fossil fuels Source: “Global Energy Perspectives” IIASA, WEC, 1998
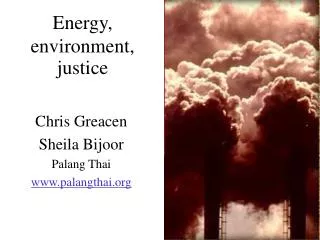
Burning fossil fuels leads to: • Environmental impacts during exploration and production • Ozone, acid deposition, and local and trans-boundary air pollution from burning • Emissions of greenhouse gases
Much is known with certainty about global warming: • Existence of natural greenhouse effect is established beyond doubt • Concentrations of greenhouse gases (GHGs) are increasing • The temperature of the earth is increasing. 1998 the hottest in at least 1000 years. • Sea levels are rising (4 to 10 inches over past 100 years) • Some GHGs will remain in the atmosphere for centuries
Atmospheric carbon dioxide (CO2) concentrations (1750 to present) Data Source: C.D. Keeling and T.P. Whorf, Atmospheric CO2 Concentrations (ppmv) derived from in situ air samples collected at Mauna Loa Observatory, Hawaii, Scripps Institute of Oceanography, August 1998. A. Neftel et al, Historical CO2 Record from the Siple Station Ice Core, Physics Institute, University of Bern, Switzerland, September 1994. See http://cdiac.esd.ornl.gov/trends/co2/contents.htm
Atmospheric methane (CH4) concentrations Data Source: D.M. Etheridge et al. Concentrations of CH4 from the Law Dome (East Side, "DE08" Site) Ice Core(a), Commonwealth Scientific and Industrial Research Organisation, Aspendale, Victoria, Australia. September 1994. Available: http://cdiac.esd.ornl.gov/ftp/trends/methane/lawdome.259. M.A.K. Khalil, R.A. Rasmussen, and F. Moraes. "Atmospheric methane at Cape Meares: Analysis of a high resolution data base and its environmental implications." Journal of Geophysical Research 98:14,753-14,770. 1993. Available: http://cdiac.esd.ornl.gov/ftp/db1007/cmeares.mon
Cumulative carbon emissions, 1950-1996 Data Source: Marland et al, 1999. Carbon Dioxide Information Analysis Center.
Per capita emissions of carbon from industrial sources, 1996 Data Source: Marland et al, 1999. Carbon Dioxide Information Analysis Center.
Earth is projected to grow warmer Source: Univ. of East Anglia, IPCC
Uncertainties still persist • Timing and regional impacts • The effects of increased cloudiness • Uncertain health and ecological impacts • Possible surprises from unanticipated effects
Common sense goals to cope with the climate threat • Reduce CO2 emissions, requiring world economy to become much more efficient • Start a world-wide shift from fossil to non-fossil energy sources
Burning fossil fuels leads to: • Environmental impacts during exploration and production • Ozone, acid deposition, and local and trans-boundary air pollution from burning • Emissions of greenhouse gases
Much is known with certainty about global warming: • Existence of natural greenhouse effect is established beyond doubt • Concentrations of greenhouse gases (GHGs) are increasing • The temperature of the earth is increasing. 1998 the hottest in at least 1000 years. • Sea levels are rising (4 to 10 inches over past 100 years) • Some GHGs will remain in the atmosphere for centuries
Temperature changes have already affected many physical and biological systems
Types of Changes Seen Hydrology and Glaciers • Glacier shrinkage • Permafrost thawing • Later freeze & earlier break up of river and lake ice Animals and Plants • Range shifts (latitudinal or altitudinal) • Abundance changes • Change in growing season length • Earlier flowering; emergence of insects; migration and egg-laying in birds • Morphology shifts (e.g. body & egg sizes)
Numbers of species or processes changing 90% of physical and 80% of biological cases identified are changing in the direction consistent with well-established temperature relationships. Birds Glaciers/ hydrology in direction expected Vegetation Invertebrates Amphibians Mammals opposite to direction expected
There are preliminary indications that some human systems have been affected by increases in floods and droughts
Catastrophic weather-related losses increased 10-fold from 1950s
Natural systems are vulnerable to climate change and some will be irreversibly damaged
Some Threatened Systems • Endorheic lakes: e.g. Caspian, Aral seas • Tropical glaciers and related water flows • Ecosystems with migration barriers - e.g. Montane ecosystems, Cape Floral Kingdom • Coral Reefs (1% of ocean area, 30% of marine species) • Mangroves- e.g. Sundarbans, last habitat of Royal Bengal Tiger • Endangered species
Many human systems are sensitive to climate change and some are vulnerable
Human Systems • Sensitive Systems • Water resources • Agriculture, forestry, fisheries • Human settlements • Industry, energy, financial services Vulnerabilities • Food and water security • Incomes and livelihoods • Human health • Infrastructure
Projected changes in climate extremes could have major consequences
Changes in extreme events (temperature) Higher maximum temperatures, more hotdays and heat waves over nearly all landareas (Very likely) • Increased death and serious illness in older agegroups and urban poor • Increased heat stress in livestock and wildlife • Shift in tourist destinations • Increased risk of damage to a number of crops • Increased electric cooling demand and reduced energy supplyreliability • Higher [Increasing] minimum temperatures,fewer cold days, frost days and cold wavesover nearly all land areas (Very likely) • Decreased cold-related human morbidity and mortality • Decreased damage to a number of crops, andincreased risk to others • Extended range and activity of some pest and diseasevectors • Reduced heating energy demand
Changes in extreme events (hydrological) More intense precipitation events (Verylikely, over many areas) • Increased flood, landslide, avalanche, and mudslide damage • Increased soil erosion • Increased flood runoff could increase recharge of some floodplain aquifers • Increased pressure on government and private insurance systems and disaster relief • Increased summer drying over most mid-latitude continental interiors and associatedrisk of drought (Likely) • Decreased crop yields • Increased damage to building foundations caused by ground shrinkage • Decreased water resource quantity and quality • Increased risk of forest fire
Risks of large scale and possibly irreversible impacts are yet to be reliably quantified
Very low likelihood in 21st century but increases with rate, magnitude and duration of climate change
Main climate changes • Sea level rise • Higher temperatures - especially on land • Hydrological cycle more intense • Changes at regional level
Sea-level transgression scenarios for Bangladesh Adapted from Milliman et al. (1989).
Percent of the continental USA with a much above normal proportion of total annual precipitation from 1-day extreme events (more than 2 inches or 50.8mm) BW 7 Karl et al. 1996
El Niño years La Niña years The 1997/98 El Niño Strongest on Record* BW 14 *As shown by changes in sea-surface temperature (relative to the 1961-1990 average) for the eastern tropical Pacific off Peru
Global ocean circulation Cooling Warm surface current Intermediate waters Warm and less saline Antarctic circumpolar current A simplified view of the global thermohaline conveyor belt, showing cooling and downwelling in the North Atlantic, warming and freshening in the southern hemisphere, and return flow as a warm surface current.
UNITED NATIONS FRAMEWORK CONVENTION ON CLIMATE CHANGERio de Janeiro : June 1992ARTICLE 2: OBJECTIVE The ultimate objective of this Convention .... is to achieve, .… stabilization of greenhouse gas concentrations in the atmosphere at a level that would prevent dangerous anthropogenic interference with the climate system. Such a level should be achieved within a time-frame sufficient : • to allow ecosystems to adapt naturally to climate change. • to ensure that food production is not threatened, and • to enable economic development to proceed in a sustainable manner.
Structure of IPCC 1997 - 2001 United Nations WMO UNEP COP/FCCC World Climate Programme IGBP Global Climate Observing system etc Subsidiary bodies of the framework convention on climate change IPCC IPCC Bureau WGII Impacts and adaptation WGI Science WGIII Mitigation Lead Authors, Contributors, Reviewers
How much will the Kyoto Protocol reduce emissions? Data Sources: United States Department of Energy, Energy Information Administration, International Energy Outlook, 1998 and 1999.
Stabilization Targets Greenhouse gas emission scenarios