Download
1 / 24
260 likes | 460 Views
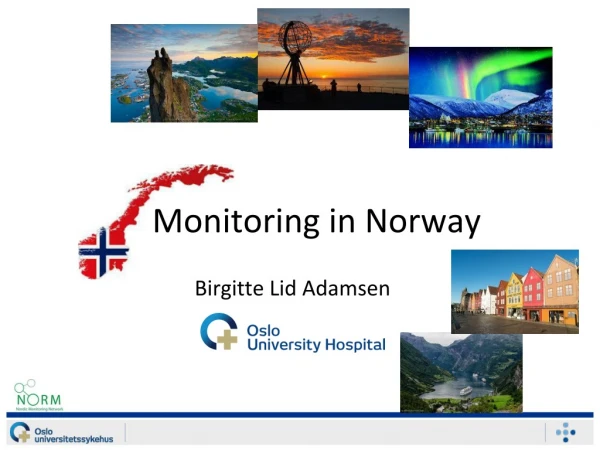
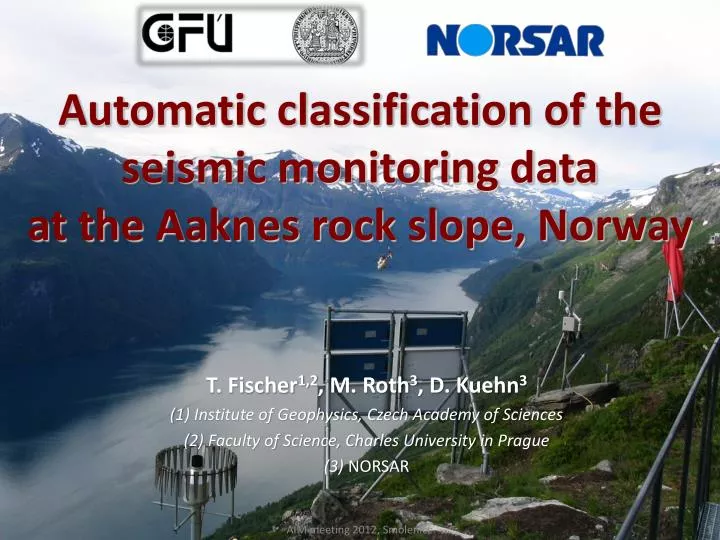
Automatic classification of the seismic monitoring data at the Aaknes rock slope, Norway. T. Fischer 1,2 , M. Roth 3 , D. Kuehn 3 (1) Institute of Geophysics, Czech Academy of Sciences (2) Faculty of Science, Charles University in Prague (3) NORSAR. Outline. Site characterization

E N D
Automatic classification of the seismic monitoring dataat the Aaknes rock slope, Norway T. Fischer1,2, M. Roth3, D. Kuehn3 (1) Institute of Geophysics, Czech Academy of Sciences (2) Faculty of Science, Charles University in Prague (3)NORSAR AIM meeting 2012, Smolenice
Outline • Site characterization • Seismic network • Data examples • Ongoing work • Spike removal • Event classification Soultz Geothermal Conference, 2011
Åknes rock slide location Rock-avalanche hazard zones in Møre & Romsdal AIM meeting 2012, Smolenice
Åknes – fjord landscape Åknes Large rockslide deposits Soultz Geothermal Conference, 2011
Åknes rock slope 1500 m asl 900 m asl Top scarp 1 km2 40 – 70 Mil. m3 Sea level Hellesylt (13 km) Stranda (15 km) AIM meeting 2012, Smolenice
Seismic monitoring Seismic network 8 3-C geophones Broadband station AKN AIM meeting 2012, Smolenice
Back-fracture and seismic network 6-8 cm/year 2-3 cm/year 3 1 4 8 7 AIM meeting 2012, Smolenice
Seismic network AIM meeting 2012, Smolenice 8
Network • 8 three-component geophones • Network size ~ 250 x 150 m • Central data acquisition in upper bunker • Radio link to Hellesylt (13 km distance) • Internet connection to NORSAR • Operational since October 2005 • Realtime data transfer and processing AIM meeting 2012, Smolenice
Data examples Rockfalls Blasts Lightning/Generator Earthquakes Microseismic Distant Spikes, noise Distant Local short Local long ftp://ftp.norsar.no/pub/outgoing/aaknesplot/latestwaveforms/ AIM meeting 2012, Smolenice
Data examples Gudvangen rock avalanche 15 June 2010, 04:22 GMT 2000 – 5000 m3 Equivalent to M 2 earthquake 150 km South of Åknes AIM meeting 2012, Smolenice
Real-time processing (existing) http://www.norsar.no/ pc-47-48-Latest-Data.aspx 4 geophones 5 geophones 6 geophones 7 geophones 8 geophones Last 30 days 12 AIM meeting 2012, Smolenice
Automatic classification Goals • Remove EM noise (lightnings etc.) - spikes • Distinguish among 4 event types • Local short (slip events, locatable) – single pulse, steep onset, <1s • Local long (rockfalls) – multiple pulses, emergent onset, >2s • Distant – very long signals with onset • Noise – no clear onset AIM meeting 2012, Smolenice
1. Remove spikes spike event Spikes detection • EM spikes synchronous on traces • Simple stacking of normalized absolute amplitudes OK • Measure maximum amplitude and half-width of the pulse AIM meeting 2012, Smolenice
1. Remove spikes Criteria for spikes: • Amax > 60% NumTr • Duration < 10 smpl AIM meeting 2012, Smolenice
2. Distinguish event types Calculate the signal envelope, sum the envelope over traces Measured parameters of the stacked signal envelope • Maximum amplitude • Left and right width at two levels, 33% and 67% • Number of local maxima • Interval btw. outer maxima Training on manually classified data set incl. 780 events during 2011: • 119 local short • 526 local long • 109 distant • 28 noise AIM meeting 2012, Smolenice
Event types - examples AIM meeting 2012, Smolenice
Event types - examples AIM meeting 2012, Smolenice
Distinguish event types - statistical analysis Choice of the statistics Aim: get the P that the analyzed event belongs to one of the event types How: calculate the P of each studied parameter Which statistics: • pdf: too discontinuous • cdf: not suitable, P(X<x) • folded cdf – peaked function • P<0.5 -> P’(X<x) • P>0.5 -> P’(X<x) AIM meeting 2012, Smolenice
Distinguish event types - statistical analysis Maximum amplitude Training: evaluate the mean distribution of the six parameters of all five event types for the manually classified training data set Folded cumulative distribution of the parameters: • Shows maximum at median • Each type characterized by a typical distribution AIM meeting 2012, Smolenice
Results of distinguishing events Automatic characterization applied to 4300 triggers in 2011 Success rate: • 81% local short events (slip events) • 73% local long events (rockfalls, avalanches) • 80% distant + noise events AIM meeting 2012, Smolenice
Summary Aaknes rock slide is continuously monitored Automatic classification of events in progress EM spikes successfully removed by stacking traces Event classification based on characterization of the shape of signal envelope Success rate about 80% achived in classifying slip events, rockfalls and distant events/noise Outlook: approximate event localization AIM meeting 2012, Smolenice
1. Remove spikes Statistical analysis of amplitudes – quantile ratios • Stationary signal – normal distribution, Q99/Q95 ~ 1.5 • Spiky signal – dominance of high amplitudes: high Q99/Q95 ratio AIM meeting 2012, Smolenice
1. Remove spikes Q99/Q95 measured on 917 manually classified events => AIM meeting 2012, Smolenice