Download
1 / 19
190 likes | 295 Views
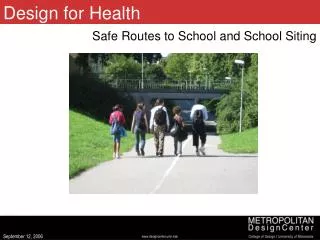
Design for Health. Safety Why Safety? Speakers. Accidents: In home and outdoors 40,000 deaths in car crashes per year; 4,700 pedestrians and 570 cyclists (Source: CDC 2000) Violence: In home, school, and in the public realm

E N D
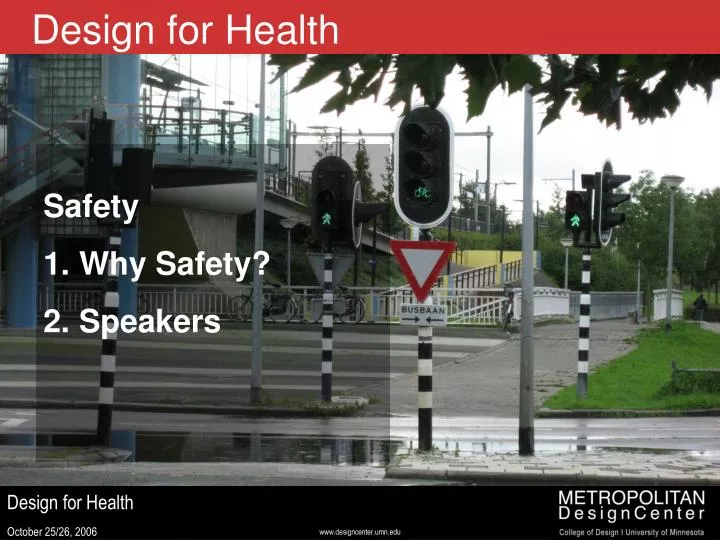
Design for Health • Safety • Why Safety? • Speakers
Accidents: In home and outdoors 40,000 deaths in car crashes per year; 4,700 pedestrians and 570 cyclists (Source: CDC 2000) Violence: In home, school, and in the public realm Annually, over the 5-year period from 1998 to 2002, teachers were the victims of approximately 234,000 total nonfatal crimes at school, including 144,000 thefts and 90,000 violent crimes (rape, sexual assault, robbery, aggravated assault, and simple assault) (Bureau of Justice Statistics 2004). Crime: Fear and reality Even perceived crime can affect behavior Why Safety?
Why Safety? Bicycle and Pedestrian Crashes 1998-2002
Poverty Red = Above average people in poverty, seniors, children, and car-less
Looked at disorder and physical activity No (unadjusted) association between overall physical activity or overall walking measured by accelerometer, survey, or diary and litter, graffiti, visible dumpsters (measured by observers in the field) Travel walking (via dairy) Positive association with litter (unadjusted, small) Leisure walking (via diary) Negative association with leisure walk (unadjusted, small) Twin Cities Walking Study
Looked at 100+ survey questions about the social and physical environment and total physical activity measured by accelerometer including questions on: traffic pedestrian safety recreation facilities Sidewalks Trees Architecture neighbors Location and accessibility Looked for significant correlations with both mean and median accelerometer readings (to eliminate “blips) but unadjusted Twin Cities Walking Study
Twin Cities Walking Study • Positive associations • 7 of 8 questions about recognizing and socializing with neighbors • 2 of 3 crime questions: Crime rate makes it unsafe during the day + night • “Many places to go within walking distance” • “Streets in my neighborhood are hilly” • 2 of 37 different destinations: closeness book store, job • Negative associations • My neighborhood has several free or low cost recreation facilities” and walking the dog (most negative!) • Wider literature had mixed findings about perceived safety and physical activity
Design for Health www.designforhealth.net
Kristen Day, UC IrvineFear and Safety in Public Spaces Wendy Sarkissian, FAPI, Sarkissian AssociatesSafety and CPTED Speakers