Download
1 / 16
160 likes | 173 Views
This study utilizes ground-based magnetometer measurements to identify drivers of geomagnetic storms in the pre-satellite era. A list of geomagnetic storms since 1930 is provided, along with probabilities for Corotating/Stream Interaction Regions (C/SIRs) and Interplanetary Coronal Mass Ejections (ICMEs) as driving mechanisms. Logistic regression models and performance metrics are employed to assess and classify the storm drivers.

E N D
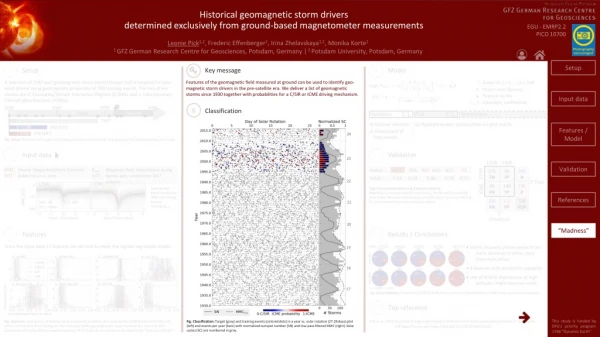
1 24 23 22 2 4 6 21 5 C/SIR ICME C/SIR 20 True ICME 19 18 3 Predicted 17 7 8 Historical geomagnetic storm driversdetermined exclusively from ground-based magnetometer measurements Setup Key message Model Setup Event ID, i = 1, ..., n = 538 Features of the geomagnetic field measured at ground can be used to identify geo-magnetic storm drivers in the pre-satellite era. We deliver a list of geomagnetic storms since 1930 together with probabilities for a C/SIR or ICME driving mechanism. A selection of 7547 past geomagnetic storm events (target set) is assigned to solar wind drivers using geomagnetic properties of 538 training events. The two driver classes are 0: Corotating/Stream Interaction Regions (C/SIRs) and 1: Interplanetary Coronal Mass Ejections (ICMEs). Driver class (binary) Feature vector Input data Intercept, coefficients Classification a) Feature selection c) Assessment of best model b) Hyperparameter optimization via grid search Features / Model Fig. Setup: Illustration of target and training storm events (crosses). The drivers of the training events are known. Validation Input data Validation Fig. SEA: Superposed epoch analysis of HMC for training events. Click for BMLT. Tab. Performance Metrics & Confusion Matrix: Matthew's Correlation Coefficient (MCC), Heidke Skill Score (HSS), Area Under Receiver Operating Curve (ROC AUC), Accuracy (ACC) & F1 score derived from the confusion matrix. References “Madness” Results | Conclusions Features From the input data 11 features are derived to enter the logistic regression model. Storm recovery phase seems to be more sensitive to driver class than main phase 4 features with predictive capability Use of B-field disturbance at high latitudes might improve result Fig. Class Statistics: Fractions of C/SIR & ICME driven storms in dependence on HMC peak and solar cycle phase. Top reference Pick et al., 2019: Evolution of large-scale magnetic fields from near Earth space during the last 11 solar cycles, JGR Space Physics, doi: https://doi.org/10.1029/2018JA026185. Fig. Classification: Target (gray) and training events (colored dots) in a year vs. solar rotation (27.28 days) plot (left) and events per year (bars) with normalized sunspot number (SN) and low-pass filtered HMC (right). Solar cycles (SC) are numbered in gray. Fig. Features: Histograms of feature values (centered, scaled to unit variance) for C/SIR (blue) and ICME (red) driven storms from the training set. The Interquartile Range (IQR) is the range between the 75th and 25th percentiles. Q2 is the 50th percentile (median). All 11 features are shown on the detail slide “Features / Model”.
1 24 23 22 2 6 4 21 5 C/SIR ICME C/SIR 20 True ICME 19 18 3 Predicted 17 8 7 Historical geomagnetic storm driversdetermined exclusively from ground-based magnetometer measurements Setup Key message Model Setup Event ID, i = 1, ..., n = 538 Features of the geomagnetic field measured at ground can be used to identify geo-magnetic storm drivers in the pre-satellite era. We deliver a list of geomagnetic storms since 1930 together with probabilities for a C/SIR or ICME driving mechanism. A selection of 7547 past geomagnetic storm events (target set) is assigned to solar wind drivers using geomagnetic properties of 538 training events. The two driver classes are 0: Corotating/Stream Interaction Regions (C/SIRs) and 1: Interplanetary Coronal Mass Ejections (ICMEs). Driver class (binary) Feature vector Input data Intercept, coefficients Classification a) Feature selection c) Assessment of best model b) Hyperparameter optimization via grid search Features / Model Fig. Setup: Illustration of target and training storm events (crosses). The drivers of the training events are known. Validation Input data Validation Fig. SEA: Superposed epoch analysis of HMC for training events. Click for BMLT. Tab. Performance Metrics & Confusion Matrix: Matthew's Correlation Coefficient (MCC), Heidke Skill Score (HSS), Area Under Receiver Operating Curve (ROC AUC), Accuracy (ACC) & F1 score derived from the confusion matrix. References “Madness” Results | Conclusions Features From the input data 11 features are derived to enter the logistic regression model. Storm recovery phase seems to be more sensitive to driver class than main phase 4 features with predictive capability Use of B-field disturbance at high latitudes might improve result Fig. Class Statistics: Fractions of C/SIR & ICME driven storms in dependence on HMC peak and solar cycle phase. Top reference Pick et al., 2019: Evolution of large-scale magnetic fields from near Earth space during the last 11 solar cycles, JGR Space Physics, doi: https://doi.org/10.1029/2018JA026185. Fig. Classification: Classified events (63% C/SIRs in blue, 37% ICMEs in red) in a year vs. solar rotation (27.28 days) plot (left) and class occurrence ratios per year with normalized sunspot number (SN) and low-pass filtered HMC (right). Solar cycles (SC) are numbered in gray. Fig. Features: Histograms of feature values (centered, scaled to unit variance) for C/SIR (blue) and ICME (red) driven storms from the training set. The Interquartile Range (IQR) is the range between the 75th and 25th percentiles. Q2 is the 50th percentile (median). All 11 features are shown on the detail slide “Features / Model”.
1 24 23 22 2 4 6 21 5 C/SIR ICME C/SIR 20 True ICME 19 18 3 Predicted 17 8 7 Historical geomagnetic storm driversdetermined exclusively from ground-based magnetometer measurements Setup Key message Model Setup Event ID, i = 1, ..., n = 538 Features of the geomagnetic field measured at ground can be used to identify geo-magnetic storm drivers in the pre-satellite era. We deliver a list of geomagnetic storms since 1930 together with probabilities for a C/SIR or ICME driving mechanism. A selection of 7547 past geomagnetic storm events (target set) is assigned to solar wind drivers using geomagnetic properties of 538 training events. The two driver classes are 0: Corotating/Stream Interaction Regions (C/SIRs) and 1: Interplanetary Coronal Mass Ejections (ICMEs). Driver class (binary) Feature vector Input data Intercept, coefficients Classification a) Feature selection c) Assessment of best model b) Hyperparameter optimization via grid search Features / Model Fig. Setup: Illustration of target and training storm events (crosses). The drivers of the training events are known. Validation Input data Validation Fig. SEA: Superposed epoch analysis of HMC for training events. Click for BMLT. Tab. Performance Metrics & Confusion Matrix: Matthew's Correlation Coefficient (MCC), Heidke Skill Score (HSS), Area Under Receiver Operating Curve (ROC AUC), Accuracy (ACC) & F1 score derived from the confusion matrix. References “Madness” Results | Conclusions Features From the input data 11 features are derived to enter the logistic regression model. Storm recovery phase seems to be more sensitive to driver class than main phase 4 features with predictive capability Use of B-field disturbance at high latitudes might improve result Fig. Class Statistics: Fractions of C/SIR & ICME driven storms in dependence on HMC peak and solar cycle phase. Top reference Pick et al., 2019: Evolution of large-scale magnetic fields from near Earth space during the last 11 solar cycles, JGR Space Physics, doi: https://doi.org/10.1029/2018JA026185. Fig. Classification: Target (gray) and training events (colored dots) in a year vs. solar rotation (27.28 days) plot (left) and events per year (bars) with normalized sunspot number (SN) and low-pass filtered HMC (right). Solar cycles (SC) are numbered in gray. Click to see classification result. Fig. Features: Histograms of feature values (centered, scaled to unit variance) for C/SIR (blue) and ICME (red) driven storms from the training set. The Interquartile Range (IQR) is the range between the 75th and 25th percentiles. Q2 is the 50th percentile (median). All 11 features are shown on the detail slide “Features / Model”.
1 24 23 22 2 6 4 21 5 C/SIR ICME C/SIR 20 True ICME 19 18 3 Predicted 17 7 8 Historical geomagnetic storm driversdetermined exclusively from ground-based magnetometer measurements Setup Key message Model Setup Event ID, i = 1, ..., n = 538 Features of the geomagnetic field measured at ground can be used to identify geo-magnetic storm drivers in the pre-satellite era. We deliver a list of geomagnetic storms since 1930 together with probabilities for a C/SIR or ICME driving mechanism. A selection of 7547 past geomagnetic storm events (target set) is assigned to solar wind drivers using geomagnetic properties of 538 training events. The two driver classes are 0: Corotating/Stream Interaction Regions (C/SIRs) and 1: Interplanetary Coronal Mass Ejections (ICMEs). Driver class (binary) Feature vector Input data Intercept, coefficients Classification a) Feature selection c) Assessment of best model b) Hyperparameter optimization via grid search Features / Model Fig. Setup: Illustration of target and training storm events (crosses). The drivers of the training events are known. Validation Input data Validation Fig. SEA: Superposed epoch analysis of BMLT for training events. Click for HMC. Tab. Performance Metrics & Confusion Matrix: Matthew's Correlation Coefficient (MCC), Heidke Skill Score (HSS), Area Under Receiver Operating Curve (ROC AUC), Accuracy (ACC) & F1 score derived from the confusion matrix. References “Madness” Results | Conclusions Features From the input data 11 features are derived to enter the logistic regression model. Storm recovery phase seems to be more sensitive to driver class than main phase 4 features with predictive capability Use of B-field disturbance at high latitudes might improve result Fig. Class Statistics: Fractions of C/SIR & ICME driven storms in dependence on HMC peak and solar cycle phase. Top reference Pick et al., 2019: Evolution of large-scale magnetic fields from near Earth space during the last 11 solar cycles, JGR Space Physics, doi: https://doi.org/10.1029/2018JA026185. Fig. Classification: Target (gray) and training events (colored dots) in a year vs. solar rotation (27.28 days) plot (left) and events per year (bars) with normalized sunspot number (SN) and low-pass filtered HMC (right). Solar cycles (SC) are numbered in gray. Click to see classification result. Fig. Features: Histograms of feature values (centered, scaled to unit variance) for C/SIR (blue) and ICME (red) driven storms from the training set. The Interquartile Range (IQR) is the range between the 75th and 25th percentiles. Q2 is the 50th percentile (median). All 11 features are shown on the detail slide “Features / Model”.
1 24 23 22 2 6 4 21 5 C/SIR ICME C/SIR 20 True ICME 19 18 3 Predicted 17 7 8 Historical geomagnetic storm driversdetermined exclusively from ground-based magnetometer measurements Setup Key message Model Setup Event ID, i = 1, ..., n = 538 Features of the geomagnetic field measured at ground can be used to identify geo-magnetic storm drivers in the pre-satellite era. We deliver a list of geomagnetic storms since 1930 together with probabilities for a C/SIR or ICME driving mechanism. A selection of 7547 past geomagnetic storm events (target set) is assigned to solar wind drivers using geomagnetic properties of 538 training events. The two driver classes are 0: Corotating/Stream Interaction Regions (C/SIRs) and 1: Interplanetary Coronal Mass Ejections (ICMEs). Driver class (binary) Feature vector Input data Intercept, coefficients Classification a) Feature selection c) Assessment of best model b) Hyperparameter optimization via grid search Features / Model Fig. Setup: Illustration of target and training storm events (crosses). The drivers of the training events are known. Validation Input data Validation Fig. SEA: Superposed epoch analysis of HMC for training events. Click for BMLT. Tab. Performance Metrics & Confusion Matrix: Matthew's Correlation Coefficient (MCC), Heidke Skill Score (HSS), Area Under Receiver Operating Curve (ROC AUC), Accuracy (ACC) & F1 score derived from the confusion matrix. References “Madness” Results | Conclusions Features From the input data 11 features are derived to enter the logistic regression model. Storm recovery phase seems to be more sensitive to driver class than main phase 4 features with predictive capability Use of B-field disturbance at high latitudes might improve result Fig. Class Statistics: Fractions of C/SIR & ICME driven storms in dependence on HMC peak and solar cycle phase. Top reference Pick et al., 2019: Evolution of large-scale magnetic fields from near Earth space during the last 11 solar cycles, JGR Space Physics, doi: https://doi.org/10.1029/2018JA026185. Fig. Classification: Classified events (63% C/SIRs in blue, 37% ICMEs in red) in a year vs. solar rotation (27.28 days) plot (left) and class occurrence ratios per year with normalized sunspot number (SN) and low-pass filtered HMC (right). Solar cycles (SC) are numbered in gray. Click to see starting position. Fig. Features: Histograms of feature values (centered, scaled to unit variance) for C/SIR (blue) and ICME (red) driven storms from the training set. The Interquartile Range (IQR) is the range between the 75th and 25th percentiles. Q2 is the 50th percentile (median). All 11 features are shown on the detail slide “Features / Model”.
1 24 23 22 2 6 4 21 5 C/SIR ICME C/SIR 20 True ICME 19 18 3 Predicted 17 7 8 Historical geomagnetic storm driversdetermined exclusively from ground-based magnetometer measurements Setup Key message Model Setup Event ID, i = 1, ..., n = 538 Features of the geomagnetic field measured at ground can be used to identify geo-magnetic storm drivers in the pre-satellite era. We deliver a list of geomagnetic storms since 1930 together with probabilities for a C/SIR or ICME driving mechanism. A selection of 7547 past geomagnetic storm events (target set) is assigned to solar wind drivers using geomagnetic properties of 538 training events. The two driver classes are 0: Corotating/Stream Interaction Regions (C/SIRs) and 1: Interplanetary Coronal Mass Ejections (ICMEs). Driver class (binary) Feature vector Input data Intercept, coefficients Classification a) Feature selection c) Assessment of best model b) Hyperparameter optimization via grid search Features / Model Fig. Setup: Illustration of target and training storm events (crosses). The drivers of the training events are known. Validation Input data Validation Fig. SEA: Superposed epoch analysis of BMLT for training events. Click for HMC. Tab. Performance Metrics & Confusion Matrix: Matthew's Correlation Coefficient (MCC), Heidke Skill Score (HSS), Area Under Receiver Operating Curve (ROC AUC), Accuracy (ACC) & F1 score derived from the confusion matrix. References “Madness” Results | Conclusions Features From the input data 11 features are derived to enter the logistic regression model. Storm recovery phase seems to be more sensitive to driver class than main phase 4 features with predictive capability Use of B-field disturbance at high latitudes might improve result Fig. Class Statistics: Fractions of C/SIR & ICME driven storms in dependence on HMC peak and solar cycle phase. Top reference Pick et al., 2019: Evolution of large-scale magnetic fields from near Earth space during the last 11 solar cycles, JGR Space Physics, doi: https://doi.org/10.1029/2018JA026185. Fig. Classification: Classified events (63% C/SIRs in blue, 37% ICMEs in red) in a year vs. solar rotation (27.28 days) plot (left) and class occurrence ratios per year with normalized sunspot number (SN) and low-pass filtered HMC (right). Solar cycles (SC) are numbered in gray. Click to see starting position. Fig. Features: Histograms of feature values (centered, scaled to unit variance) for C/SIR (blue) and ICME (red) driven storms from the training set. The Interquartile Range (IQR) is the range between the 75th and 25th percentiles. Q2 is the 50th percentile (median). All 11 features are shown on the detail slide “Features / Model”.
Historical geomagnetic storm driversdetermined exclusively from ground-based magnetometer measurements Setup Input data Features / Model Validation References Leonie Pick, M.Sc. Ph.D. Candidate GFZ German Research Centre for Geosciences Section 2.3 Geomagnetism leonie.pick@gfz-potsdam.de +49 331 288-28922 Find me on ResearchGate! “Madness”
1 Historical geomagnetic storm driversdetermined exclusively from ground-based magnetometer measurements Setup Training events (t0): Input data Features / Model Tab. Training events: Resources for peak times and classes of training storm events. Validation References “Madness” Fig. Sketch of ICME & CIR: Sketch of an ICME (left) and a CIR (right). DRS and DFS mean developing reverse and forward shock, respectively. Figure taken from Kilpua et al., 2017. Fig. Solar wind and geomagnetic responses: Responses to an ICME (left) and CIR (right) based on OMNI data (1-min for solar wind and AE, 1-hour for Dst and Kp). Vertical lines in the left plot are the ICME shock and the boundaries of the magnetic cloud. Vertical lines in the right plot are the start of the CIR, the stream interface and the end of the CIR (from CIR catalog by L. Jian). Figure taken from Kilpua et al., 2017.
2 Historical geomagnetic storm driversdetermined exclusively from ground-based magnetometer measurements Setup Target events (te): Input data Features / Model Validation References “Madness” Tab. Selection parameters: Optimized selection parameters for target events. HMC5d, 11y: Low-pass filtered HMC with cutoff period at 5 days or 11 years. Fig. Event selection steps: Illustration of target event selection steps at different time resolutions from annual (top) to daily (bottom). Fig. HMC distribution: HMC index distribution of target events. The interquartile range falls between -39 and -66 nT (dashed lines). The median (Q2) is located at -50 nT. Click for Kp distrubution.
2 Historical geomagnetic storm driversdetermined exclusively from ground-based magnetometer measurements Setup Target events (te): Input data Features / Model Validation References “Madness” Tab. Selection parameters: Optimized selection parameters for target events. HMC5d, 11y: Low-pass filtered HMC with cutoff period at 5 days or 11 years. Fig. Event selection steps: Illustration of target event selection steps at different time resolutions from annual (top) to daily (bottom). Fig. Kp distribution: Kp index distribution of target events. The interquartile range falls between 4- and 5+ (dashed lines). The median (Q2) is located at 5-. Click for HMC distribution.
1 Historical geomagnetic storm driversdetermined exclusively from ground-based magnetometer measurements Setup Hourly Magnetospheric Currents Index (HMC) The HMC index (Pick et al., 2019; available via GFZ Data Services) measures the activity of large-scale magnetospheric currents on Earth's surface from 1900 to 2015. It resolves the absolute intensity of low-frequency variations, especially at periods relevant to the solar cycle (~11 yr), more robustly than existing geomagnetic indices. HMC is based on hourly means of vector magnetic field measurements from 21 mid latitude geomagnetic observatories (and their predecessors) obtained from World Data Centre for Geomagnetism, Edinburgh. Input data Features / Model Validation References “Madness” Fig. HMC Spectrum: Power spectral density (a) and magnitude squared coherence (b) of HMC and comparable indices Dcx (Mursula & Karinen, 2005), RC (Olsen et al., 2014) and the external axial dipole coefficient of COV-OBS.x1 (Gillet et al., 2015, periods ≥ 2 years). Fig. Geomagnetic observatories: The observatories contributing to HMC are located within 50° of geomagnetic latitude (gray shaded), excluding the equator (gray line). Between 1930 and 2015 seven out of 21 observatories (thick circles) have predecessors, so that data from a total of 14+7*2=28 observatories are used in this study.
2 Historical geomagnetic storm driversdetermined exclusively from ground-based magnetometer measurements Setup Magnetic field disturbance (BMLT) The magnetic field disturbance (B in nT) from individual observatories are sorted into 1-h magnetic local time (MLT) bins, centered on half hours, and termed B(0), B(1), ..., B(23). Two measures of B-field asymmetry are: To mitigate the problem of missing values the data is averaged over six 1-h MLT bins to give: B6 centered on 06:30 h (dawn), B12 on 12:30 h (noon), B18 on 18:30 h (dusk) and B0 on 00:30 h (midnight). Input data Features / Model Validation References “Madness” Fig. Magnetic field disturbance in MLT sectors for storm peaks: Magnetic field residua (radial direction, -100 nT) at storm peak time per 1-h MLT sector (angle; noon left, midnight right) for a) the median of 538 target events, b) two examplary storms. The “fitted” line is calculated from a 2nd order Fourier Fit to the 24 B(MLT) values. 100% measurement coverage means that the MLT sector was sampled by at least one observatory at all storm peak hours. Fig. Superposed epoch analysis of training events: Five basic HMC related properties (rows) of superposed C/SIR (left) and ICME (right) driven storms with epoch times given by the event peaks (local HMC minima). IQR is the interquartile range, Q2 is the 50th percentile (median).
1 Historical geomagnetic storm driversdetermined exclusively from ground-based magnetometer measurements Setup Features Input data Features / Model Validation References “Madness” Fig. Features: Histograms of standardized (centered, scaled to unit variance) features for C/SIR (blue) and ICME (red) driven storms with Interquartile Range (IQR) and 50th percentile (Q2, median). Feature 11 is a synthetic “ideal” feature. Tab. Features: 11 features derived from ground-based magnetometer data. HMCny: Low-pass filtered HMC with cutoff period at n years; te: UT of event peak; MLT: Magnetic local time.
2 Historical geomagnetic storm driversdetermined exclusively from ground-based magnetometer measurements Setup Features & Model a) Fig. Feature Selection: An optimum of 8 features is found in terms of Matthew's correlation coefficient (MCC). Results are averaged over a 4-fold cross-validation with 134 (135) events per fold, repeated 25 times. Vertical lines indicate 2·std. Input data Features / Model Validation Fig. Model Optimization: 10 combinations of parameters O1 & O2 are tested in a nested K-fold cross-validation with K=3 in the inner loop (optimization) and K=4 in the outer loop (validation). Both loops are repeated 25 times, resulting in 7500 runs per combination. Gray barsshow the fraction of total runs for which model x has the highest MCC, black bars show MCC of model x, averaged over all runs. b) References “Madness” Tab. Features: 11 features derived from ground-based magnetometer data. HMCny: Low-pass filtered HMC with cutoff period at n years; te: UT of event peak; MLT: Magnetic local time.
Historical geomagnetic storm driversdetermined exclusively from ground-based magnetometer measurements Setup a) b) Input data Features / Model Validation c) References “Madness” Fig. Confusion matrix: Confusion matrix (black square, a). N & P are the condition negative & positive, PN and PP are the predicted P and N. Row normalized confusion matrix (b) and column normalized confusion matrix (c). Tab. Metrics: Some metrics commonly used to assess the skill of a (binary) classifier. MCC is used here to a) select the most discriminative features and b) optimize the hyperparameters. Values in the upper rows are calculated on the validation sets and those in the bottom rows are from the training sets. Fig. Diagnostics: Receiver Operating Curves (ROC, left) and Precision-Recall Curves (right) from 4-fold cross-validation, repeated 25 times (100 curves). The Area-Under-Curve (AUC) is given for the mean curves (red).
Historical geomagnetic storm driversdetermined exclusively from ground-based magnetometer measurements Setup Geomagnetic models and indices: Gillet et al., 2015: Stochastic forecasting of the geomagnetic field from the COV-OBS.x1 geomagnetic field model, and candidate models for IGRF-12, Earth, Planets and Space, 67(71), http://doi.org/10.1186/s40623-015-0225-z. Mursula & Karinen, 2005: Explaining and correcting the excessive semiannual variation in the Dst index, Geophysical Research Letters, 32(L14107), doi: https://doi.org/10.1029/2005GL023132. Olsen et al., 2014: The CHAOS-4 geomagnetic field model, Geophysical Journal International, 197(2), 815–827, http://doi.org/10.1093/591gji/ggu033. Pick & Korte, 2018: HMC index V. 1.0., GFZ Data Services, http://doi.org/10.5880/GFZ.2.3.2018.006. Pick et al., 2019: Evolution of large-scale magnetic fields from near-Earth space during the last 11 solar cycles, Journal of Geophysical Research: Space Physics, 124, http://doi.org/10.1029/2018JA026185. Training events: Jian et al., 2006: Properties of Stream Interactions at One AU During 1995 – 2004, Solar Physics, 239(337), http://doi.org/10.1007/s11207-006-0132-3. Jian et al., 2006: Properties of Interplanetary Coronal Mass Ejections at One AU During 1995 – 2004, Solar Physics, 239(393), http://doi.org/10.1007/s11207-006-0133-2. Jian et al., 2011: Comparing Solar Minimum 23/24 with Historical Solar Wind Records at 1 AU, Solar Physics, 274(321), http://doi.org/10.1007/s11207-011-9737-2. Richardson et al., 2000: Sources of geomagnetic activity over the solar cycle: Relative importance of coronal mass ejections, high-speed streams, and slow solar wind, Journal of Geophysical Research, 105(A8), pp. 18.203-18.213. Shen et al., 2017: Statistical study of the storm time radiation belt evolution during Van Allen Probes era: CME- versus CIR-driven storms, J. Geophysical Research: Space Physics, 122, 8327–8339, http://doi.org/10.1002/2017JA024100. Turner et al., 2009: Geoefficiency and energy partitioning in CIR-driven and CME-driven storms, Journal of Atmospheric and Solar-Terrestrial Physics, 71, 1023–1031, http://doi.org/10.1016/j.jastp.2009.02.005. Properties of ICMEs and SIRs (exemplary): Borovsky & Denton, 2006: Differences between CME-driven storms and CIR-driven storms, Journal of Geophysical Reserach, 111(A07S08), http://doi.org/10.1029/2005JA011447. Kilpua et al., 2017: Geoeffective Properties of Solar Transients and Stream Interaction Regions, Space Science Reviews, 212, 1271–1314, http://doi.org/10.1007/s11214-017-0411-3. Occurrence statistics of C/SIR and ICME driven storms (exemplary): Richardson & Cane, 2012: Solar wind drivers of geomagnetic storms during more than four solar cycles, J. Space Weather and Clim., 2(A01), http://doi.org/10.1051/swsc/2012001. Machine learning (exemplary): Campareale et al. (eds.), 2018: Machine Learning for Space Weather, Elsevier, ISBN: 978-0-12-811788-0. Liemohn et al., 2018: Model evaluation guidelines for geomagnetic index predictions, Space Weather, 16, http://doi.org/10.1029/2018SW002067. Input data Features / Model Validation References “Madness”