Download
1 / 15
160 likes | 280 Views
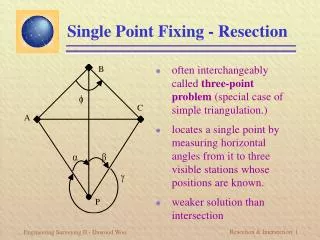
Rectangular Coordinate System: The field or plane set up in a certain grid pattern in which we will be illustrating number relationships by plotting points and drawing lines and curves.

E N D
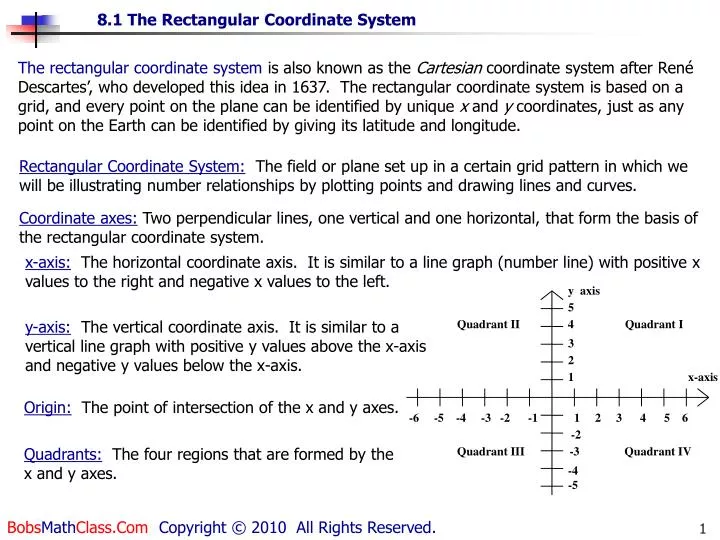
Rectangular Coordinate System: The field or plane set up in a certain grid pattern in which we will be illustrating number relationships by plotting points and drawing lines and curves. Coordinate axes: Two perpendicular lines, one vertical and one horizontal, that form the basis of the rectangular coordinate system. x-axis: The horizontal coordinate axis. It is similar to a line graph (number line) with positive x values to the right and negative x values to the left. y axis 5 Quadrant II 4 Quadrant I 3 2 1 x-axis -6 -5 -4 -3 -2 -1 1 2 3 4 5 6 -2 Quadrant III -3 Quadrant IV -4 -5 y-axis: The vertical coordinate axis. It is similar to a vertical line graph with positive y values above the x-axis and negative y values below the x-axis. Origin: The point of intersection of the x and y axes. Quadrants: The four regions that are formed by the x and y axes. The rectangular coordinate system is also known as the Cartesian coordinate system after René Descartes’, who developed this idea in 1637. The rectangular coordinate system is based on a grid, and every point on the plane can be identified by unique x and y coordinates, just as any point on the Earth can be identified by giving its latitude and longitude.
Ordered pair: Each point on the plane can be identified by a pair of numbers called an ordered pair. The first number of the pair is the x value. It is the measure of the horizontal distance from the origin. The second number of the pair is the y value. It is the measure of the vertical distance from the origin. Coordinates: The two numbers that make up the ordered pair. Abscissa: The first or x-coordinate of the ordered pair. Ordinate: The second or y-coordinate of the ordered pair. An ordered pair is always placed in a set of parentheses and the coordinates are separated by a comma. ( 5 , 2) abscissa vertical distance (horizontal distance) (ordinate) Procedure to graph an ordered pair on a rectangular coordinate system: Step 1 Starting from the origin, move horizontally the same number units designated by the x-coordinate. You will move to the right if the x-coordinate is positive, to the left if it is negative. Step 2 From your new location, use the y-coordinate to determine your vertical movement. You will move up if the y-coordinate is positive, down if the y-coordinate is negative. Step 3 Place a dot with your pencil at the point where you end up. Step 4 Label the point by writing the ordered pair next to the point.
y axis 5 4 3 2 1 x-axis -6 -5 -4 -3 -2 -1 1 2 3 4 5 6 -2 -3 - -4 -5 • Your Turn Problem #1 • Plot the following points on the x-y coordinate system • a. ( 2, - 3 ) • ( -1, -5 ) • ( 4, 2 ) • ( - 3, 1 ) • ( 0, 3 ) (-3,4) • e. • c. • d. • a. b. • Example 1: Graph the ordered pair (-3,4) Solution:The x-coordinate is –3 and they-coordinate is 4. So, from the origin, move 3 units to the left, then, 4 units up.
Graphing Straight Lines using the Intercept Method 1. Make a table with two columns to list ordered pairs with x and y labeled at the top of each column. 2. Find the x and y intercepts. This means let x = 0 and find the y value. Then let y = 0 and find the x value. This will only give two ordered pairs. 3. We must now find a third point. Choose any value for x (not 0, and not the x value found when we let y = 0. Then find its corresponding y value. • Plot all the points and draw a straight line through the points. Lines continue infinitely in both directions. You can show this by placing arrows at both ends of the line. Graphing Linear Equations We will now go through some basic graphing techniques. In later sections, there will be more information on some of these graphs. In general, any equation of the form Ax + By = C where A, B, and C are constants (A and B not both 0) and x and y are variables, is a linear equation, and its graph is a straight line. In other words, the exponents of the variables can only be 1. Example: 4x + 3y =12 If any of the variables have an exponent other than 1, then the graph is a non linear equation (not a straight line). Example: y=x2 is not a straight line.
x y Let x=0, solve for y. Then let y=0, solve for x. 3 0 2 0 • • • Next Slide Example 2. Graph 3x+2y=6 using the intercept method. First, make a table to list the ordered pairs. Also, sketch a rectangular coordinate system (an xy-plane). You should use graph paper, and then draw in the x and y axis. You can also sketch your own graph paper (see slide 1), draw the axes and tick marks for the scale. 4 -3 Now we need a third point. Choose any value for x except 0 and 2. Let’s choose x=4. Now we can plot the points and sketch the graph.
x y Answer: -5 0 3 • 0 5 3 1/3 • • Your Turn Problem # 2
Graphing Straight Lines by Choosing Points if y is written on the LHS. 1. Make a table of two column table to list ordered pairs with x and y labeled at the top of each column. 2. Choose 3 values for x. Let x = 0 be one of the values (this gives the y-intercept). 3. Plot all the points and draw a straight line through the points. Lines continue infinitely in both directions. You can show this by placing arrows at both ends of the line. Next Slide Choosing Points Method (not really a formal name) If an equation is given with y on the LHS (example: y = 2x – 4), we can start choosing values for x. We can choose any values we want. You can choose x =278, but that means you would have show 258 on the x axis. So we will usually choose small numbers for x.
x y • • • Next Slide Example 3. Graph y = 2x – 3 by choosing values for x. First, make a table to list the ordered pairs. Also, sketch a rectangular coordinate system. Choose 3 values for x. There are an infinite number of points on a line. We may choose different values for x, but the line will still look the same. -3 -1 1 0 1 2 Now we can plot the points and sketch the graph.
Your Turn Problem # 3 x y Answer: 1 -1 -3 0 1 2 • • •
x y • • • Next Slide Choose 3 values for x. Of course x = 0 will be one of the values. To make the computations easier, choose values that are divisible by the denominator. In this case, choose values such as 5, 10, and –5. -1 1 3 0 5 10 Now we can plot the points and sketch the graph.
Your Turn Problem # 4 x y Answer: 1 -1 -3 0 3 6 • • •
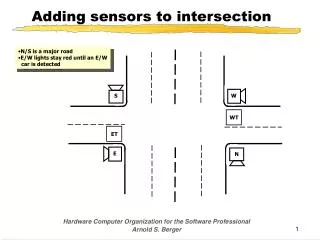
Vertical and Horizontal Lines The graph of a linear equation with one of the variables missing is either a horizontal or vertical line. Graph of a Vertical Line The graph of x = a is a vertical line passing through (a, 0). Graph of a Horizontal Line The graph of y = b is a horizontal line passing through (0, b). y axis x axis Next Slide
-2 -2 y axis x axis Next Slide First, get the variable by itself on the LHS.
The End B.R. 11-8-06 Your Turn Problem #6