Download
1 / 8
80 likes | 172 Views
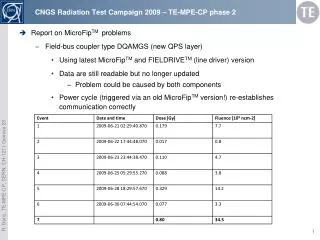
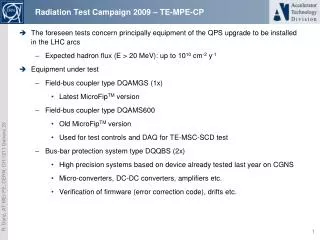
The LHC S plice Resistance M onitor ( Labview & RADE). Zinour Charifoulline, TE-MPE-CP. SM : Introduction. Evaluation of LHC splice resistance is based on the processing of signals collected by nQPS -hardware (2). The original signals are taken from so called “diode voltage taps”(1),

E N D
The LHC Splice Resistance Monitor (Labview & RADE) Zinour Charifoulline, TE-MPE-CP TE-TM, Z.Charifoulline
SM: Introduction • Evaluation of LHC splice resistance is based on the processing of signals collected by • nQPS-hardware (2). The original signals are taken from so called “diode voltage taps”(1), • integrated and stored to LHC Logging Data Base (3). • The signals represent time series for: • Current in the circuit – I_MEAS(t); • Voltage drop on magnet – U_MAG(t); • - Voltage drop on bus bar – U_RES(t); Magnet • Splice Monitor: • It is an application to measure bus segment SC splice resistances of LHC Main Circuits by use of nQPS* hardware. • (*) nQPS is a new protection layer to detect the high resistive bus bars joints (or splice) in Main Magnet circuits: • 2048 bus segments in the machine, about 10000 splices (or joints); • average splice resistance is about 300pΩ, or 1-10nΩ per segment; • just a single suspicious joint can cause a big problem (2008); • NB. Specificity: Developer & Main User was the same person. Logging DB U_RES(t), U_MAG(t) I_MEAS(t) nQPS BS (A&B) 2 3 1 U_MAG: ±15.9V@24bits(1.9µV) PtP≈500µV(noise) U_RES: ±12.8mV@24bits(1.5nV) PtP≈50µV-100µV (noise) 5Hz, 50points moving average 2048 channels (x2) Bus Bar 1nΩx6kA=6µV 4 Magnet Resistance of magnet splices is calculated from equation U_MAG(I) = Uo + Rmag * I. Resistance of bus segment and induction compensation coefficients are calculated from U_RES(I) = Uo + Rbus * I + ∆α*U_MAG(I). Procedures for time series extraction, processing and visualization are incorporated into “Splice Resistance Monitor” application (4). TE-TM, Z.Charifoulline
SM: Main functionality (1) From the beginning the Application used - to verify the signal names of 2048 new boards (integrity between supervision, layout and logging databases); - to check the nQPS cabling by monitoring and analyzing the signals during the powering; • to calculate the compensation coefficients, to load them to the hardware and to re-check afterwards; • Finally all Main Magnet bus segments had been checked during 2009&2010 HWC campaigns and analyzed by SM-tool. Measured values of splice resistances added appreciable confidence in a safety of LHC machine U_RES(I) = U0 + Rbus*I + ∆α*U_MAG(I); U_MAG(I) = U0 + Rmag*I; • Splice Resistance Monitor (SM) core functionality (circuit based): • Query the Time series U_RES(t), U_MAG(t), I_MEAS(t) and reconstruct them to UI-curves; • Detect of current plateaus and ramps from I_MEAS(t) signal; • Calculate induction compensation coefficients from the current’s ramps; • Calculate Splice Resistances from plateaus; TE-TM, Z.Charifoulline
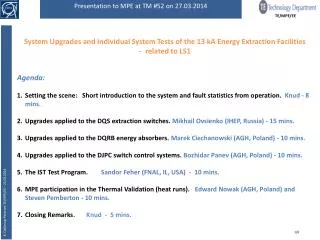
SM: Main functionality (2) Compensation coefficients Whole sector signals view Noise statistics “steps” noise [abcopm**]> sm- production version [abcopm**]> smprev- previous version “…/user/pma/PM_app86/nQPS/prod” Zinour Charifoulline
SM: Where is the RADE? Reserve Data Source: directly from QPS & FGC Front End. Used not often, but works well. Thanks Odd! Data extraction from LHC Logging DB: “SQL_MA.vi” Works reliable and stable. Thanks Vitaly! TE-TM, Z.Charifoulline
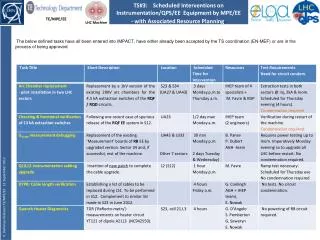
SM: Main functionality (3) ~2-3 hours • Since April 2010 when regular beam operation started, data from every 3.5TeV ramps had been semi-automatically analyzed to check possible bus splice degradation in time. Nothing degraded so far. • Next step for the application: • - make it fully automatic (switch to a server mode by help and support from RADE-team ) ; • - separate the Developper&User, i.e. last version upgrade and well detailed documentations; • 2010 HWC. • 5kA pyramids have been analyzed and 2009 results confirmed (almost); • 3.5Tev Ramps & Batch mode. • The application can work now in batch mode: it detects ramp (1hour on 3.5Tev); calculates resistance of the whole • machine from last 3 hours data; saves resistance tables, screenshots of the ramp, screenshots for noisy channels… • Magnet resistance calculation. • Calculation of magnet resistance (internal splices) is activated now (with additional “manual” filtering, see pic); • Estimation of resistance time evolution (in development); • Different types ofstatistical analysis of results (in development); TE-TM, Z.Charifoulline
SM: Status of 1.9K Splice Resistances • in LHC Main Magnet Circuits Maximum Splice Resistance in a Bus Segments over LHC 25-Nov-2010 12 23 34 45 56 67 78 81 Main Magnet Resistances over LHC 25-Nov-2010 12 23 34 45 56 67 78 81 TE-TM, Z.Charifoulline
Thanks! TE-TM, Z.Charifoulline