Download
1 / 43
430 likes | 575 Views
Building a spatial simulation model of happiness and well-being in Britain. Dimitris Ballas Department of Geography University of Sheffield http://www.sheffield.ac.uk/sasi e-mail: d.ballas@sheffield.ac.uk. Understanding Population Trends and Processes: A Secondary Data Analysis Initiative

E N D
Building a spatial simulation model of happiness and well-being in Britain Dimitris Ballas Department of Geography University of Sheffield http://www.sheffield.ac.uk/sasi e-mail: d.ballas@sheffield.ac.uk Understanding Population Trends and Processes: A Secondary Data Analysis Initiative http://www.uptap.net
Outline • What is happiness? • Building geographical simulation models of happiness and well-being at different geographical levels • Happiness and inequality • Concluding remarks: on-going research aims and objectives
What is happiness? • Greece, circa 500 BC • Socrates, Plato Aristotle (384-322 BC) Nichomachean Ethics (350 BC) http://classics.mit.edu/Aristotle/nicomachaen.html England, 18th century Bentham (1748 – 1832), the principle of Utility John Stuart Mill (1806 – 1873) – Utilarianism http://www.utilitarianism.com/
What is happiness? Can it be measured? Human perceptions of happiness vary and depend on a wide range of factors What is the good life for man? The question of what is a full and rich life cannot be answered for an individual in abstraction from the society in which he lives (Aristotle, Nicomachean Ethics) Can happiness be measured? Happiness is subjective and no objective theory about the ordinary concept of happiness has the slightest plausibility (Sumner, 1996)
What is happiness? Can it be measured? A person who has had a life of misfortune, with very little opportunities, and rather little hope, may be more easily reconciled to deprivations than others reared in more fortunate and affluent circumstances. The metric of happiness may, therefore, distort the extent of deprivation in a specific and biased way. (Sen, 1987: 45, my emphasis) Oswald and Clark (2002): statistical regression models of happiness measuring the impact of different life events upon human well being
Happiness and economics • Happiness is defined as utility • Utility can be measured and compared across people • Marginal utility of income is assumed to be higher for poor people than for rich people Hicks and Kaldor proposed a measure of national welfare similar to GDP adjusted for leisure and pollution
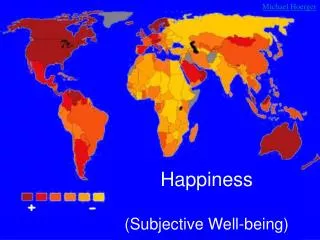
BUT can Happiness be measured? Richard Layard (2005), Andrew Owswald (2002) and others argue that it can! “By happiness I mean feeling good – enjoying Life and feeling is wonderful. And by Unhappiness I mean feeling bad and wishing things were different” (Layard, 2005)
General happiness Self Completion (4) Question Number and Text KS1L : Have you recently....been feeling reasonably happy, all things considered? Value Label % More so than usual 1 13.2 Same as usual 2 72.8 Less so than usual 3 11.8 Much less than usual 4 2.2 Source: The British Household Panel Survey, 2001
General Health Questionnaire (1) Have you recently: • Been able to concentrate on whatever you are doing? • Lost much sleep over worry? • Felt that you are playing a useful part in things? • Felt capable of making decisions about things? • Felt constantly under strain? • Felt you could not overcome your difficulties?
General Health Questionnaire (2) Have you recently: • Been able to enjoy your normal day-to-day activities? • Been able to face up to your problems? • Been feeling unhappy or depressed? • Been losing confidence in yourself? • Been thinking of yourself as a worthless person? • Been feeling reasonable happy all things considered?
Can happiness be measured? • Positive and negative feelings are inversely correlated • Happiness can be thought of as a single variable (Layard, 2005; Frey and Stutzer, 2002)
Region / Metropolitan Area * GHQ: general happiness Crosstabulation % within Region / Metropolitan Area GHQ: general happiness Missing Proxy More than Same as or wild respondent usual usual Less so Much less Total Region / Inner London 4.5% 4.3% 14.4% 66.7% 7.7% 2.4% 100.0% Metropolitan Outer London 2.8% 5.7% 10.6% 68.6% 10.2% 2.1% 100.0% Area R. of South East 2.2% 5.0% 11.9% 70.2% 9.1% 1.6% 100.0% South West 1.7% 3.5% 11.3% 74.1% 8.0% 1.4% 100.0% East Anglia 2.1% 1.3% 10.0% 77.4% 8.5% .8% 100.0% East Midlands 2.2% 1.4% 10.9% 76.0% 8.3% 1.3% 100.0% West Midlands 6.6% 4.6% 11.5% 66.0% 9.9% 1.3% 100.0% Conurbation R. of West Midlands .8% 2.2% 10.7% 73.7% 10.7% 2.0% 100.0% Greater Manchester 1.0% 2.6% 11.1% 75.2% 7.7% 2.4% 100.0% Merseyside .4% 4.7% 9.9% 75.5% 8.6% .9% 100.0% R. of North West 1.3% 4.0% 14.5% 70.7% 8.1% 1.3% 100.0% South Yorkshire 1.0% 1.7% 11.3% 71.0% 13.3% 1.7% 100.0% West Yorkshire 2.7% 2.7% 10.7% 73.9% 8.5% 1.4% 100.0% R. of Yorks & Humberside 1.2% 5.5% 10.1% 76.5% 5.5% 1.2% 100.0% Tyne & Wear .4% 3.8% 14.0% 72.7% 6.8% 2.3% 100.0% R. of North 1.8% 2.3% 10.8% 72.3% 11.5% 1.5% 100.0% Wales 3.9% 1.5% 8.8% 70.9% 12.6% 2.3% 100.0% Scotland 1.8% 2.3% 10.8% 74.0% 9.9% 1.3% 100.0% Total 2.2% 3.4% 11.3% 72.2% 9.2% 1.6% 100.0% Geographies of happiness in Britain Source: The British Household Panel Survey, 2001
Modelling happiness and well-being • Regression models • Multi-level modelling approaches • Microsimulation and Spatial Microsimulation
Microsimulation in Economics • First conceptualised and developed by Orcutt (1957) • Since then, very successful history • Wide range of applications: tax/benefit, budget analysis, measurement of poverty, policy impact assessment etc. • Microsimulation is an established method in Economics
What is microsimulation? • A technique aiming at building large scale data sets • Modelling at the microscale • A means of modelling real life events by simulating the characteristics and actions of the individual units that make up the system where the events occur
A microsimulation approach to happiness research A person who has had a life of misfortune, with very little opportunities, and rather little hope, may be more easily reconciled to deprivations than others reared in more fortunate and affluent circumstances. The metric of happiness may, therefore, distort the extent of deprivation in a specific and biased way. (Sen, 1987: 45)
Towards geographical simulation models of happiness Census of UK population: • fine geographical detail • Small area data available only in tabular format with limited variables to preserve confidentiality • cross-sectional British Household Panel Survey: • sample size: more than 5,000 households • Annual surveys (waves) since 1991 • Coarse geography • Household attrition
Static spatial microsimulation • Use BHPS sample to populated Census table with more data • reweighting an existing national micro-dataset to fit geographical areas • Computer simulation • attempts to minimise the error between the census value and the simulated value for each geographical area (OA)
Spatial microsimulation methodologies • Probabilistic synthetic reconstruction techniques (IPF-based approaches) • Combinatorial optimisation methods (hill-climbing, simulated annealing, genetic algorithms) • Event modelling
Spatial microsimulation procedures The construction of a micro-dataset from samples and surveys Static What-if simulations, in which the impacts of alternative policy scenarios on the population are estimated Dynamic modelling, to update a basic micro-dataset and future-oriented what-if simulations: for instance if the current government had raised income taxes in 1997 what would the redistributive effects (and impacts on the happiness levels!) have been between different socio-economic groups and between central cities and their suburbs by 2007?
Selecting Census variables to be used as small area “constraints” (1) • Type of accommodation • Number of rooms • Tenure • Amenities • Car and van ownership • Gender • Age • Marital status • Relationship in household • Ethnic group • Long-term illness • Whether working, retired, looking for work
Selecting Census variables to be used as small area “constraints” (2) • Hours worked per week • Occupation • Name and address of employer • Address of place of work • Daily journey to work • Degree, professional and vocational qualification 2001 Census – new questions • General health • Provision of unpaid care • Time since last paid employment • Size of employer’s organisation • Voluntary question on religion
Selecting Census variables to be used as small area “constraints”(3) • Correlation analysis • Regression models • Multi-level modelling approaches
The next step: dynamic spatial microsimulation • Household 219 • 1991 Begins married with 2 children, employed, owner-occupier, income £21560, happiness level 1 • 1996 Child 1 leaves home – sets up new household with partner (tenure: rented, both employed) NEW HOUSEHOLD FORMATION HERE (Household new399), happiness level 2 • 1998 Child 2 leaves home, goes to university (leaves the region) • Household NEW 399 • 1996 Household formation – rented accommodation 1999 Household marries 2000 Relocation to new household as income increases (owner-occupied)
The next step: dynamic spatial microsimulation • Household 1756 • 1991 Married couple with no children: owner-occupied, happiness level 1 • 1993 Divorce – male seeks new household in rented accommodation (new household formation), happiness level, 4 • 1994 Female finds partner and stays in original dwelling, happiness level 1 • 1996 Male finds a new partner – move to owner-occupied, happiness level 1 • 1997 Male looses job – moves to unemployed, happiness level drops to 4 • 1997 Female remarries – move to bigger dwelling as household income increases • 1998 Male reemployed • 2000 Income increases in new male household - seek relocation
Spatial microsimulation of happiness and well-being for policy analysis: towards the “real” SimCity! http://simcity.ea.com/
Inequality and happiness “A house may be large or small; as long as the surrounding houses are equally small it satisfies all social demands for a dwelling. But if a palace arises beside the little house, the little house shrinks to a hovel… [and]… the dweller will feel more and more uncomfortable, dissatisfied and cramped within its four walls.” (Marx and Engels, 1848: 268)
Happiness and inequality “When we are at home, most of us like to live in roughly the same style as our friends or neighbours, or better. If our friends start giving more elaborate parties, we feel we should do the same. Likewise if they have bigger houses or bigger cars.” (Layard, 2005: 43)
Towards geographical models of happiness • adding a geographical dimension to explore the geography of well-being, based on the estimated database through the 1990s and early 2000s • maps of well-being can be produced for different types of people (i.e. by age) • Income and wealth inequalities and happiness (what does money buy you in different places?)
Happiness and inequality “… similarly at work, I compare my income with what my colleagues get, in so far as I hear about it. If they get a raise above inflation and I get inflation only, I get mad.” (Layard, 2005: 44)
The “One Percent Is Always The Same” (OPIATS) rule “This rule implies that if my income is $100,000 and I give $20,000 of it to the poor, my well-being falls by a fifth. If I divide my $20,000 equally between ten people with incomes of $10,000 ten people’s well-being will rise by a fifth. The gains from this gift will thus exceed the losses by a factor of ten. The utilitarian case for governmental redistribution almost always reflects this logic: taxing the rich won’t do them much harm, and helping the poor will do them a lot of good. If you look at the actual relationship between income and outcomes like health and happiness the OPIATS rule seldom describes the relationship perfectly but it comes far closer than the ‘One Dollar is Always the Same’ rule, which is the only rule under which income inequality does not affect health or happiness”. (Jencks, 2002: 57, my emphasis)
Exploring geographies of happiness “… the broad impression is that social class stratification establishes itself primarily as a national social structure, though there are perhaps also some more local civic hierarchies – for instance within cities and US states. But it should go without saying that classes are defined in relation to each other: one is higher because the other is lower, and vice versa. The lower class identity of people in a poor neighbourhood is inevitably defined in relation to a hierarchy which includes a knowledge of the existence of superior classes who may live in other areas some distance away.” (Wilkinson and Pickett, 2006: 7, my emphasis)
Exploring geographies of happiness • What is the degree of happiness attained by different types of individuals in various localities and regions in Britain? Does space matter? • Happiness and inequality and space: rethinking regional economic policy • Happiness, prosperity and regional/local GDP growth • Is the source of happiness or unhappiness personal or it has more to do with inequalities in the distribution of income, wealth, skills and capability? • Explore the impact of government income and wealth redistribution policies on happiness (e.g. basic income policies)
Happiness and inequality “…while economic goods and services are obvious important, many people believe that inequality also affects human welfare in ways that are independent of any given household’s purchasing power. Even if my family income remains constant, the distribution of income in my neighbourhood or my nation may influence my children’s educational opportunities, my life expectancy, my chance of being robbed, the probability I will vote and perhaps even my overall happiness.” (Jencks, 2002: 57)
Links between income inequality and well-being (Wilkinson and Picket, 2006) • The proportion of analyses classified as wholly supportive falls from 83% (of all wholly supportive or unsupportive) in the international studies to 73% in the large sub-national areas, to 45% among the smallest spatial units. • The spatial scale at which people make their social comparisons is more likely to be the nation state (arguably reflecting socio-economic position) than it is to locality (reflecting position within neighbourhood).
on-going research aims • Explore the relationship between what defines happiness and socio-economic phenomena, such as unemployment and income inequalities, by attempting to answer questions such as: “would society be more equal, if people were prepared to pay higher taxes, in order to ameliorate socio-economic inequalities?” • Build a geographical model of happiness that will be capable of providing information on the different degrees of happiness attained by people in different regions and localities, under alternative scenarios and happiness definitions. • examine the relationship of happiness and capability, on the basis of past relevant research (such as the work of Sen, 1993) • examine the possible impact of happiness of income and wealth redistribution • investigate the possible impact on happiness of basic income policies which could increase the economic independence of all individuals in society (Van Parijs, 1997 and 2001). • projections of how British society will look in the next 10 and 20 years, under alternative assumptions on social values.