Download
1 / 25
260 likes | 488 Views
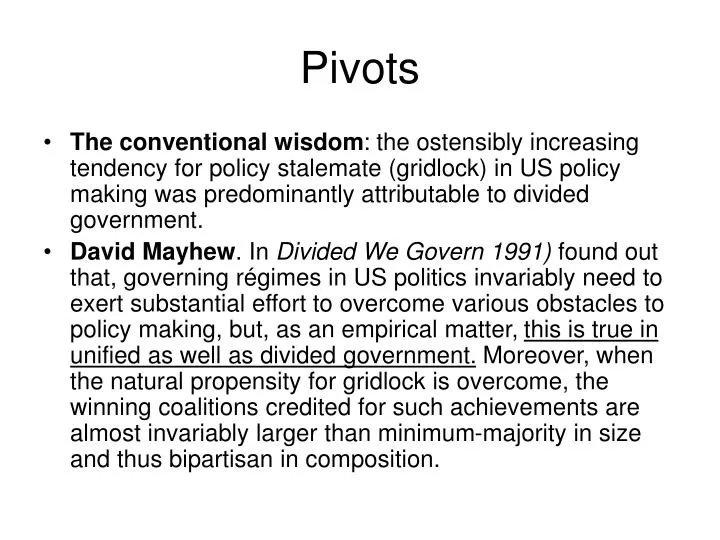
Pivots. The conventional wisdom : the ostensibly increasing tendency for policy stalemate (gridlock) in US policy making was predominantly attributable to divided government.

E N D
Pivots • The conventional wisdom: the ostensibly increasing tendency for policy stalemate (gridlock) in US policy making was predominantly attributable to divided government. • David Mayhew. In Divided We Govern 1991) found out that, governing régimes in US politics invariably need to exert substantial effort to overcome various obstacles to policy making, but, as an empirical matter, this is true in unified as well as divided government. Moreover, when the natural propensity for gridlock is overcome, the winning coalitions credited for such achievements are almost invariably larger than minimum-majority in size and thus bipartisan in composition.
Pivots • Pivotal politics :Assumptions: • For any given issue the government may consider, a single, primary dimension is sufficient for representing decisionmakers’ essential conflicting interests. Each player (legislators in a unicameral lawmaking body plus a president) has symmetric, singlepeaked preferences over a unidimensional policy space, x R. • The pivotal politics theory deviates from its predecessors in its specification of voting rules (non the simple majority rule): • Majority to stop the filibustering =3/5 (minority to keep the filibustering just a bit more 2/5) • Majority to override the presidential veto=2/3 (minority to keep the presidential veto just a bit more 1/3)
Floor agenda (median voter)model Not propose q Median Voter in Congress (m) m Propose
Pivotal theory Game Not propose m or 2f-q q yes Median Voter in Congress (m) 2v-q President yes yes f (pivot) no v (pivot) Propose no no q q
The Filibuster Pivot Minority that can block any cloture (termination of the filibuster) Proposal that is just acceptable for the filibuster pivot
Presidential veto pivot Minority that can block the veto overiding 50 63 66 69 71 m p* v q pr 2v-q Proposal that is just acceptable for the veto pivot
Procedural Cartel theory Game Not propose q Median Voter in Majority Party (r) m (median voter in Congress) m amend Propose Not amend q
Equilibrium in the Procedural Cartel theory Suboptimal outcomes for both r and m
Theoretical puzzle in the PCT model • In the segment (r , 2r-m) the status quo outcome is suboptimal both for the median voter in the party and the median voter in the parliament: Why would the majority party median (as the presumed procedural dictator) and the legislative median (as the implicit Constitutionally stipulated chooser of “the rules of [the House’s] proceedings”) consent to using a type of gatekeeping rule when other available rules lead Pareto-superior outcomes? • The designated gridlock interval in the party cartel theory is distinctively lopsided relative to the legislative median. Gridlock favors the majority party at the expense of not only the minority party but also the chamber median voter. Yet, the theory predicts that in all observable instances of successful lawmaking, the outcome is the legislative median, not the majority-party median. For policies to be noncentrist therefore, depends crucially upon a historical path in which erstwhile median outcomes somehow become stuck away from the center and within the current-period gridlock interval.
Empirical test of PCT versus Median voter model • Def. to be rolled : A party is said to be rolled when a majority of its members vote against a measure, a majority of the opposite party’s members vote for a measure, and the measure is enacted • The rate at which a party is rolled, therefore, is defined as the proportion of final-passage roll calls on which the previous conditions are met. • A party with a low roll rate is presumed to have agenda power, while, conversely, a party that is rolled often is said to be weak.
Empirical test of PCT versus Median voter model • Hypotheses from PCT model • a rational gatekeeper, in this case the majority party, is never rolled (do not propose something just to vote against and to lose). Consequently its roll rate should be constant and zero. • In contrast, the minority party is expected to be rolled regularly because it has no presumed gatekeeping rights. • Hypothesis from the median voter model ( floor agenda model, FAM) • roll rates for each party will be a function of the distance between that party’s median voter and the legislature’s median voter.
Hypothesis from the median voter model ( floor agenda model, FAM) Regression analysis 1)Minority roll rate = + |d-m| + 2)Majority roll rate = + |r-m| + Hypotheses PCT : >0 ; =0 Hypotheses FAM: >0 ; >0
Hypotheses from PCT model Regression analysis 1)Minority roll rate = + |d-m| + 2)Majority roll rate = + |r-m| + Hypotheses PCT : >0 ; =0 Hypotheses FAM: >0 ; >0 Minority party median Majority party median
I) and VI) : both party will vote for changing q. No rolls. Minority party median Majority party median
II) and III) : q is changed and d is rolled, namely only r vote for the change Minority party median Majority party median
IV) and V) : q is not changed Minority party median Majority party median
If the status quo was uniformly distributed then I ) and VI ) =1/3 of circumstances without rolls II) And III) = 1/3 of circumstances with Minority party rolls IV) And V) No change, no roll calls Therefore 6 circumstances but only 4 with roll calls ½ of roll calls with Minority Party rolls; 0 roll calls with Majority Party rolls Minority party median Majority party median
Comments on PCT tests • Results seem to confirm at least partially the hypotheses • However it is empirically implausible the assumption behind the PCT model of fixed, exogenous, costant and uniformly distributed status quo: defies history (status quo is the product of the previous congresses..)
1) How to “endogenize” the status quo distribution and test all three theories • Postulate a model of stochastic status quo points as a function of prior equilibrium policies, namely, qt = x*t-1 +ε where • qt= status quo at time t • x*t-1= equilibrium policy from the prior period • ε = random variable distributed uniformly or normally with mean=0 and variance to be specified (and adjusted for robustness checks). • Begin with a neutral policy seed x*0 centered on historic average of chamber preferences and apply the stochastic status quo model to generate a distribution of status quo points for t=1
2) How to “endogenize” the status quo distribution and test all three theories • Incorporate real-world data (DW-Nominate scores) to identify pivot points and majority and minority party medians for each congress in the time series. • For each theory under consideration, indexed j {M,C,P} for median-voter,procedural-cartel, and pivotal-politics, respectively, and for each Congress t in the time series: • Use the theory to calculate equilibrium outcomes x*t-1 • Calculate the corresponding predicted proportions of minority-party rolls yt,j, and majority-party rolls zt,j • Reapplythe model of stochastic status quo points to x*t to deriveqt+1
3) How to “endogenize” the status quo distribution and test all three theories • Conduct comparative institutional analysis by assessing the relative abilities of theories to predict actual party rolls. Specifically, define the sum of squared rollrate errors (SSRE) for theory j as: • Where yt and zt are the actual observed minority an majority party roll rates