Download
1 / 22
240 likes | 444 Views
1. Independent t-tests. Uses a sampling distribution of differences between means. The test statistic for independent samples t-tests. Recall the general form of the test statistic for t-tests: Recall the test statistic for the single sample t-test…. 1. Horizontal axis value = sample mean.

E N D
1 Independent t-tests Uses a sampling distribution of differences between means
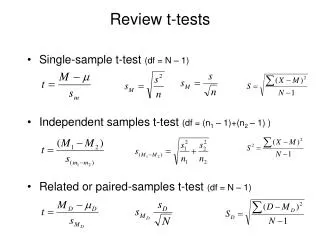
The test statistic for independent samples t-tests • Recall the general form of the test statistic for t-tests: • Recall the test statistic for the single sample t-test… 1 Horizontal axis value = sample mean Distribution mean = mean of distribution of sample means 2 Distribution SD = SD of distribution of sample means 3
The test statistic for independent samples t-tests • So how about the independent samples t-test? Horizontal axis value = ? 1
The test statistic for independent samples t-tests • So how about the independent samples t-test? Horizontal axis value = difference between 2 sample means 1
The test statistic for independent samples t-tests • So how about the independent samples t-test? Distribution mean = ? 1 2
The test statistic for independent samples t-tests • So how about the independent samples t-test? 1 1 SD of sampling distribution = ?
The test statistic for independent samples t-tests • So how about the independent samples t-test? SD of sampling distribution = ? 1 the SD of the distribution of differences between 2 sample means
On the SD of the distribution: • Look at the SD (SEM) in more detail Where: 1
What affects significance? • Mean difference • With larger observed difference between two sample means, it is less likely that the observed difference in sample means is attributable to random sampling error • Sample size • With larger samples, it is less likely that the observed difference in sample means is attributable to random sampling error • Sample SD: • With reduced variability among the cases in each sample, it is less likely that the observed difference in sample means is attributable to random sampling error • See applet: http://physics.ubishops.ca/phy101/lectures/Beaver/twoSampleTTest.html 1
d of f for the test statistic • The d of f changes from the one-sample case • comparing two independent means 1 becomes If the 2 groups are of equal size
Reporting t-test in text 1 Descriptive statistics for the time to exhaustion for the two diet groups are presented in Table 1 and graphically in Figure 1. A t-test for independent samples indicated that the 44.2 ( 2.9) minute time to exhaustion for the CHO group was significantly longer than the 38.9 ( 3.5) minutes for the regular diet group (t18 = - 3.68, p 0.05). This represents a 1.1% increase in time to exhaustion with the CHO supplementation diet. Should also consider whether the difference is meaningful – see effect sizes, later
Reporting t-test in table • Descriptives of time to exhaustion (in minutes) for the 2 diets. 1 Note: * indicates significant difference, p 0.05
Reporting t-test graphically 1 Figure 1. Mean time to exhaustion with different diets.
Reporting t-test graphically 1 Figure 1. Mean time to exhaustion with different diets.
Summary/Assumptions of theindependent t-test • Use when the assumption of no correlation between the samples is valid • Don’t test for it…just examine whether the assumption is fair • Use when the two samples have similar variation (SD) • Test for in output (see next few slides) 1 2
t-tests in SPSS • First note the data format: one continuous variable (in this case, age) 1
t-tests in SPSS • Second, run the procedure: drag the test variable over and specify μ 1
t-tests in SPSS • Third, check the output: N, Mean, SD, SEM 1 significance (if α = .05, then < .05 is significant) 2 df = n-1 = 19
independent-tests in SPSS • First, check the data: One grouping variable 1 One test variable
independent-tests in SPSS • Second, run the procedure: 1
independent-tests in SPSS • Second, run the procedure: 1 2 1. slide variables over 2. click “define groups” 3. define groups
independent-tests in SPSS • Third, examine the output: N, Mean, SD, SEM 1 2 test for equal variances (> .05 is good) significance (if α = .05, then < .05 is significant) 3 4