Download
1 / 23
260 likes | 642 Views
Carbon Neutral Energy from Waste Gasification. Presented by Allen Medearis and Trip Dacus April 14, 2010 University of Tennessee at Chattanooga. Outline. Gasification UTC Natural Gas Replacement Design -Background -Material and Energy Balance -Cost Analysis -Conclusions

E N D
Carbon Neutral Energy from Waste Gasification Presented by Allen Medearis and Trip Dacus April 14, 2010 University of Tennessee at Chattanooga
Outline Gasification UTC Natural Gas Replacement Design -Background-Material and Energy Balance-Cost Analysis -Conclusions Garbage Gasification Design-Basis -ChemCAD -Material Balance -Power Production -Economic Analysis -Conclusion
Gasification Waste Syngas Gasifier Extracting Energy From Organic Materials Converts Carbonaceous Material Into Carbon Monoxide and Hydrogen Uses High Temperatures (>700°C) and Controlled Oxygen Content Result is Syngas (CO and H2)
Replacing UTC’s Natural Gas Usage • Use Wood and Paper • Gasify to Make Fuel to Use in Furnaces • Replace UTC’s Natural Gas Usage +20% with Syngas • Assumptions -Wood and Paper Are Viewed as Cellulose- Syngas Can Be Sufficiently Burned to Power the Furnaces
Material and Energy Balance ResultsReplacing 120% of Natural Gas Usage • Material Composition of Feed - 70% Cellulose - 20% Water - 10 % Ash • Feed Stream: 22.7 Tons/Day of Wood and Paper • Exit Stream: 17 Tons/Day of Syngas
Cost Analysis Capital Costs-Grinder $60,000-Cleaner $350,000-Gasifier $330,000 Lang Factor (3.63) Labor Cost $300,000/year Annual Power Cost $10,000/year
Cost Analysis (cont’d) Total Capital Cost: $2.7 Million Time to Payoff: 3.6 Years Total Savings Per Year: $770,000
Conclusions About UTC Design Great Way for University to Save Money Fast Payoff Reduces Carbon Footprint of University Recommend University Fund Further Research
Outline Gasification UTC Natural Gas Replacement Design -Background-Material and Energy Balances -Cost Analysis -Conclusions Garbage Gasification Design-Basis -ChemCAD -Material Balance -Power Production -Economic Analysis -Conclusion
Introduction • Gasify Chattanooga Waste for Production of Syngas • Burn Syngas in Combined Cycle Gas Turbine for Power Production Combined Cycle Gas Turbine Waste Syngas Electricity Gasifier
Basis - Assumptions • 4.4 lbs of trash per person per day • Chattanooga population - 300,000 • Use existing trash collection infrastructure
Basis - Representative Chattanooga Trash Output – 660 tons/day of trash
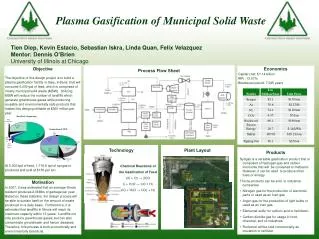
Plant Design Schematic Combustion Turbine Air Filter Waste Power Gasifier Ash/Slag Grinder Exhaust Air Power Steam Turbine Condenser
Material Balance Non-Fossil CO2 980 tons/day Waste, 660 tons/day H2O 340 tons/day RPM Gasifier System N2 2350 tons/day Air, 3080 tons/day Ash/Slag 70 tons/day
Capital Cost Analysis Capital Cost of Equipment = $27M
Capital Cost Analysis CTM – Capital cost of the plant Cp,i – Purchased cost for major equipment units FLang – Lang Factor (3.63 for solid-fluid processing) Total Capital Cost = $120 M
Economic Analysis • Displaced Expenses • 74MW sold at $0.05 per kW·hr = $31M • Expenses • 10% of electricity for plant usage = $3M • 10 employees at $100,000 per year = $1M Net Income = $27M
Cash Flow Diagram 4 ¼ Years to pay off capital investment
Recommendation Based on this design, we recommend that the city should fund a detailed design study
Thank you for listening! Are there any questions?