Download
1 / 19
190 likes | 338 Views
South Atlantic circulation from global 1/12 º resolution simulations Z. Garraffo 1 , S. Garzoli 2 , S. Dong 3 , M. Baringer 2 , A. Srinivasan 1 U. Miami (CCS); AOML/NOAA; CIMAS With NOAA/AOML funding. WORK IN PROGRESS Study of the Global 1/12 º HYCOM products for the South Atlantic.

E N D
South Atlantic circulation from global 1/12º resolution simulations Z. Garraffo1, S. Garzoli2, S. Dong3, M. Baringer2, A. Srinivasan1 U. Miami (CCS); AOML/NOAA; CIMAS With NOAA/AOML funding
WORK IN PROGRESS • Study of the Global 1/12º HYCOM products for the South Atlantic. • Objectives: • Analyze different models and compare with observations • Determine the main characteristics of the modeled South Atlantic flows, in particular in relation to the Atlantic Meridional Overturning Circulation • SIMULATIONS: • HYCOM global 1/12º produced at NRL: • Climatological simulation (expt 09.4) with updated forcing (ECMWF with satellite corrected winds, with 6-hourly anomalies), updated source and layer structure. • 2004-2006 simulation, NOGAPS winds. • Hindcast 2004-2006 (with data assimilation) • (simulations produced by Metzger, Smedstad, Wallcraf; Chassignet and Hurlburt PIs) • Regional model for extra diagnostics
AX22 • AOML High density XBT lines: • Temperature from AOML high density XBT lines, • Salinity, based on historical T/S relationship (derived from CTD and Argo floats) • Upper ~800m
Climatological model AMOC (yr 15) Hindcast AMOC (yr 2005) 15Sv 12Sv 2Sv 1Sv climatological interannual hindcast
S. Atlantic volume transport: upper, deep, bottom upper 10 Sv bottom -10 Sv deep 20N 35S Nested model, as global model, with purpose of saving extra diagnostic quantities. Boundary conditions from global model. Our region of higher insterest (with A. Wallcraft’s advise) daily archives (full), and every time step flux (dashed) (regional model shows lower Drake transport than global model, 130 Sv vs 150 Sv)
AX22 XBT HYCOM From Dong, Garzoli, Baringer • Temperature from AOML high density XBT lines, • salinity, based on historical T/S relationship (derived from CTD and Argo floats) (150 Sv full 4yr mean) (151 Sv full 4yr mean) Baroclinic, unadjusted Adjusted with total interannual model transport
Drake passage: Seasonal cycle of volume and heat transport (Observational transports from Dong, Garzoli, Baringer) Temperature transport (Pw) Volume transport (SV) Observations Climatol. HYCOM expt 09.4 (yr 11-15) Interannual HYCOM expt 05.8 Hindcast
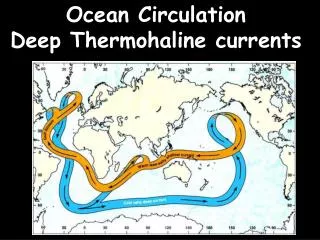
South Atlantic circulation: Upper, intermediate, deep flows SACW (100-500m) AAIW (500-1200m) NADW (>2000m) Adapted from Stramma & England 1999
> 2000m mean instantaneous Deep western boundary current eddies after 8ºS topography (as in Dengler, Schott, Eden, Brant, Nature 2004)
11S velocity section 6 year mean expt 09.4 5 section avg Schott et al, JPO 2005 22.8 -3.7 4.1 -19.3 Deep south: -35.5Sv Deep north: 18.9Sv Net deep: -16.6Sv Upper 23.8Sv Deep south: -19.3Sv Deep north: 4.1Sv Net deep: -15.2Sv Upper 22.8 Sv
Upper flow: Lay 10, 100m Interannual Climatological TG STG 15S SSEC AgC SAtlC MC ACC Hindcast
Interannual Climatological 18S Hindcast Intermediate flow: lay 18, ~1000m
Transport: Upper branch (integrated in layers) 11Sv 14Sv 11Sv Climatological interannual Hindcast Color plots: longitudinal dependence of meridional transport integrated from the west (from 70W). Box: region of closed sections. Brazil Current intensifies to the south in Climatolog. and Interannual expts Exchange with lower layers
Deep flow, lay 28, ~2000-3000m Interannual Climatological Hindcast
Transport: Deep branch Climatological interannual Hindcast Color plots: longitudinal dependence of meridional transport integrated from west. Exchange with upper layers
Transport: Bottom branch Climatological interannual 0.5Sv 1Sv Hindcast 1.5 Sv
Conclusions Simulations reproduce the known aspects of the South Atlantic circulation, for the upper and deep flow: main currents and locations, mean pathways. Temperature transport time series at Drake passage is in good agreement between model and observations. Future work Further identification of mean pathways and quantification of the current transports in all the simulations. Comparison with Argo floats reconstructions. Estimation of water mass transformations from HYCOM.
Climatological year 11-15 Interannual 2004-2006 Hindcast 2004-2006 80ºS 30ºN Lay 18 Lay 28 Salinity section showing AAIW minimum Climatology (PH3) Jan section
28.5S 28.5S difference Upper volume transport difference accum flux – daily archives

![The European North Atlantic shelf [Ocean-Shelf Exchange, internal waves]](https://cdn0.slideserve.com/118374/the-european-north-atlantic-shelf-ocean-shelf-exchange-internal-waves-dt.jpg)