Download
1 / 54
580 likes | 725 Views
Mass Spectrometry. Prof. Nizam M. El-Ashgar. Mass Spectroscopy Lecture 1 Prof. Nizam M. El- Ashgar. MS is still spectroscopy?. What is a mass spectrometer?. Illustration of the basic components of a mass spectrometry system. Ionization Source. Mass Analzyer. Detector. selected ions.

E N D
Mass Spectrometry Prof. Nizam M. El-Ashgar
Mass Spectroscopy Lecture 1 Prof. Nizam M. El-Ashgar
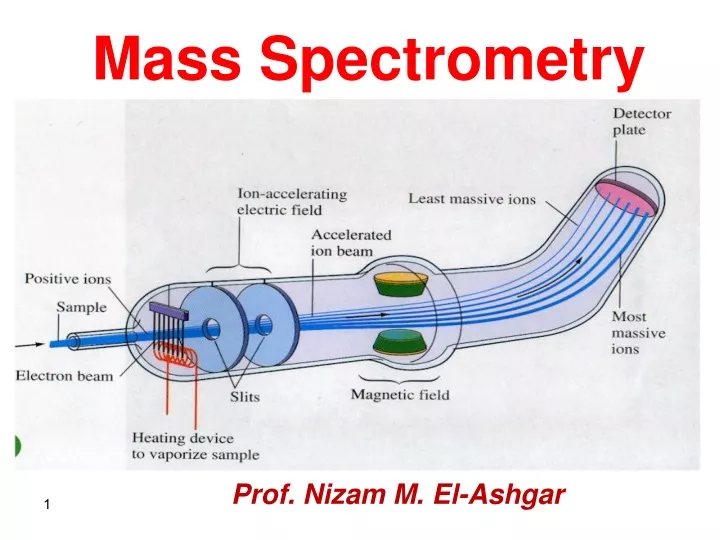
What is a mass spectrometer? Illustration of the basic components of a mass spectrometry system. • Ionization • Source • Mass • Analzyer • Detector • selected • ions • Data • System • Inlet • all ions
Lets talk about mass! • Atomic mass of Carbon • 12.000000000000000000000000000 amu • Atomic mass of Chlorine • 35.4527 amu • Atomic mass of Hydrogen • 1.00794 amu 1amu = 1 dalton (Da)
What about isotopes? • Atomic mass of Carbon • 12.000 amu for 12C but 13.3355 for 13C • Atomic mass of Chlorine • 34.9688 amu for 35Cl and 36.9659 for 37Cl • Atomic mass of Hydrogen • 1.00794 amu for H and 2.0141 for D!
Just for clarification Atomic mass • amu, atomic mass units • “Da” or Dalton. • kD (kiloDalton for macromolecules) • 1 amu = 1.66056*10-27 kg. • proton, mp = 1.67265*10-27 kg, • neutron, mn = 1.67495*10-27 kg.
Ways to define and calculate the mass of an atom, molecule or ion • Average mass:calculated using the atomic weight, which is the weighted average of the atomic masses of the different isotopes of each element in the molecule. Often used in stoichiometric calculations. • Nominal mass الوزن الشكلي: calculated using the mass of the predominant isotopes of each element rounded to the nearest integer value that corresponds to the mass number. • Monoisotopic mass: calculated using the extract mass of the most abundance isotope for each constituent element. Use monoisotopic mass if possible in MS
Monoisotopic mass When the isotopes are clearly resolved the monoisotopic mass is used as it is the most accurate measurement.
Average mass Average mass corresponds to the centroid of the unresolved peak cluster When the isotopes are not resolved, the centroid of the envelope corresponds to the weighted average of all the the isotope peaks in the cluster, which is the same as the average or chemical mass.
Monoisotopic mass / Average Mass • Average mass • Monoisotopic mass
1981.84 1982.84 1983.84 Mass spectrum of peptide with 94 C-atoms (19 amino acid residues) “Monoisotopic mass” No 13C atoms (all 12C) One 13C atom Two 13C atoms
4361.45 4360.45 m/z Isotope pattern for a larger peptide (207 C-atoms)
Mass spectrum of insulin 2 x 13C 13C 12C: 5730.61 Insulin has 257 C-atoms. Above this mass, the monoisotopic peak is too small to be very useful, and the average mass is usually used.
Differences between Masses C20H42 • Nominal: (20 x 12) + (42 x1) = 282 u اقرب اعداد صحيحة للمكونات • Monoisotopic: (20 x12) + (42 x 1.007825) = 282.33 الاكثر شيوعا للمكونات • Average: (20 x 12.011) + (42 x 1.00794) = 282.5535 مجموع المعدلات للمكونات • C100H202 • Nominal: (100x12) + (202x1) = 1402u • Monoisotopic: (100x12) + (202x1.007825) = 1403.5807 • Average (100x12.011)+(202x1.00794) = 1404.7039
Mass Spectrometry • Mass spectrum is obtained by converting components of a sample into rapidly moving gaseous ions and resolving them on the basis of their mass-to-charge(m/z) ratios. • Most generally applicable of analytical tools since capable of qualitative and quantitative information about both atomic and molecular composition of inorganic and organic compounds.
MS is used • For the characterization of molecules ranging from small inorganic and organic molecules to polymers and proteins. • With MS we might be able to determine the molecular weight of a molecule ion, the elemental composition of a molecule ion, and the presence of certain functional groups. • For mechanistic studies of gas-phase (ion) chemistry. This is also relevant for a better understanding of the chemistry in our atmosphere and in space. • As a mass detector coupled to a GC, HPLC, capillary electrophoresis (CE), and thermo-gravimetric analysis. • As an integrated mass detector in many high vacuum systems. A truly interdisciplinary and versatile analytical method
Molecular Mass Spectrometry Provides information about: 1- The elemental composition of samples of matter. 2- The structures of inorganic, organic and biological molecules. 3- The qualitative and quantitative composition of complex mixture. 4- The structure and composition of solid surfaces. 5- Isotope ratios of atoms in samples.
Acuracy of MWt Mesurments • For large samples such as biomolecules,molecular masses can be measured to within an accuracy of 0.01% of the total molecular mass of the sample. • Example: an error within a 4 Daltons (Da) or atomic mass units (amu) for a sample of 40,000 Da. This is sufficient to allow minor mass changes to be detected, e.g. the substitution of one amino acid for another, or a post-translational modification. • For small organic moleculesthe molecular mass can be measured to within an accuracy of 5 ppm or less, which is often sufficient to confirm the molecular formula of a compound, and is also a standard requirement for publication in a chemical journal.
Where are mass spectrometers used? Mass spectrometers are used in industry and academia for both routine and research purposes. The following list is just a brief summary of the major mass spectrometric applications: Biotechnology:the analysis of proteins, peptides, oligonucleotides. Pharmaceutical:drug discovery, combinatorial chemistry, pharmacokinetics, drug metabolism. Clinical:, hemoglobin analysis, drug testing. Environmental:water quality, food contamination . Geological:oil composition .
Mass Spectra • When the electron beam ionizes the molecule, the species that is formed is called a radical cation, and symbolized as M+•. • The radical cation M+• is called the molecular ion or parent ion. • The mass of M+• represents the molecular weight of M. • Because M+• is unstable, it decomposes to form fragments of radicals and cations that have a lower molecular weight than M+•. • The mass spectrometer analyzes the masses of cations.
A mass spectrum is a plot of the amount of each cation (its relative abundance) versus its mass to charge ratio (m/z, where m is mass, and z is charge). • Since z is almost always +1, m/z actually measures the mass (m) of the individual ions.
Mass Spectrometry • The tallest peak in the mass spectrum is called the base peak. • The base peak is also the M peak, although this may not always be the case. • Though most C atoms have an atomic mass of 12, 1.1% have a mass of 13. Thus, 13CH4 is responsible for the peak at m/z = 17. This is called the M + 1 peak.
Since the molecular ion is unstable, it fragments into other cations and radical cations containing one, two, three, or four fewer hydrogen atoms than methane itself. • Thus, the peaks at m/z 15, 14, 13 and 12 are due to these lower molecular weight fragments.
Explanation • The collisions between energetic electrons and analyte molecules (enough E) lead to excitation. • Relaxation leads to fragmentation to lower masses ions. • Attraction of positive ions through the slit of a mass spectrometer and sorted according to m/z ratios and appear in the Mass spectrum. • Mass spectrum is a plot of relative intensity versus m/z. • Base peak has the value of 100 (arbitrarily). • The remaining computed as % of the base-peak height. • Modern MS programmed base-peak and normalize the remaining peaks relative to that peak.
Mass Spectrometer All Instruments Have: • Sample Inlet • Ion Source • Mass Analyzer • Detector • Data System
Ion sources (Ionization) Starting point: Formation of gaseous analyte Ions. Methods of ion formation: Two major categories: 1- Gas-phase sources • The sample is first vaporized and then ionized. • Restricted to thermally stable compounds of BP < 500 0C. • Limited to Compounds of MWt’s <103 dalton . 2- Desorption sources • The sample in a solid or liquid state is converted directly into gaseous ions (not require volatilization of analyte molecules). • Applicable to nonvolatile and thermally unstable samples. • Applicable to analytes having of 105dalton or larger.
The deciding criteria of Ion Source are often the following • Physical state of the sample. • Volatility and thermal stability of the sample. • Type of information sought. Comparison • EI, CI, and DI (Desorption ionization) are suitable for high resolution MS; • EI works well only for thermally stable and volatile samples; • CI, SI, and DI cause much less fragmentation (normally no radicals are formed); • DI and SI must be combined with tandemمتزامن mass detection (MS-MS) to extract more structural information from fragmentation;
Hard and Soft Sources (another classification) Hard Sources: • Impart sufficient E to analyte molecules (become of high excited E state). • Relaxation involves rupture of bonds producing fragment ions with m/z < than that of molecular ion. • Provides useful information about kinds of functional groups and structure information. Soft Sources: • Causes little fragmentation. • Mainly the spectrum consists of the molecular ion peak and few peaks. • Supplies accurate information about MWt of analyte. Both are useful for analysis
The Electron-Impact Sources (EI) • The sample is brought to a temperature high enough to produce a molecular vapor, which is then ionized by bombarding the resulting molecules with a beam of energetic electrons. • Positive ions forced by small potential difference through accelerator plates to mass analyzer. M + e- M.+ + 2e- where, M = analyte molecule, M.+= molecular ion. • Relaxation then usually takes place by extensive fragmentation, giving a large number of positive ions of various masses that are less than that of the molecular ion. • These lower mass ions are called daughter ions.
Gaseous sample bombarded with beam of energetic electrons. Electrons produced at heated W or Rh wire and accelerated to energy of about 70 eV. Typically one in every million molecules undergoes ionization.
Schematic representation of an electron ionization ion source. M represents neutral molecules; e-, electrons; M+· , the molecular ion; F+, fragment ions; Vacc, accelerating voltage; and MS, the mass spectrometer analyzer.
Schematic representation of an electron ionization ion source. • about every 1/1000 molecule is ionized • only cations • the sample is heated up until a sufficient vapour pressure is obtained • sample pressure in the ion source is about 10-5 torr
The positive ions produced are attracted through the slit in the first accelerating plate by a small potential diff (5 V). • With magnetic sector instrument high potentials (103 to 104) are applied to the accelerator plates) KE = qV = zeV e = 1.6022 x 10⁻¹⁹ coulombs, V = Accelerating Voltage, Z= The number of charges. • KE of an ion is independent of its mass and depends only upon its charge and accelerating potential. • Velocity of an ion depends on its mass KE = 1/2m2 or = (KE/m)1/2
Electron Impact Advantages • Well-Established. • Fragmentation Libraries. • Insoluble Samples. • Interface to GC. • Non-Polar Samples. • They are convenient and produce high ion currents. • Extensive fragmentation can lead to unambiguous identification of analytes.
Ionization Energy of Compounds The ionization energies of many compounds are on the order of 7-14 eVbut electron energies of 70 eVare often chosen for EI-MS to achieve higher signal intensities and to avoid changes in the mass spectrum with small changes in electron energy. The energy domain: 1 J (kg m2 s-2) = 6.24145 x 10¹⁸ eV 1 J mol-1 = 1.03641 x 10⁻⁵ eVEnergies of chemical bonds are typically between 100 and 600 kJ mol-1(C-H = 435 kJ mol-1; C-O = 356 kJ mol-1, C-N = 305 kJ mol-1), which are equivalent to 1-6 eV.
The time domain: A 70 eV electron has a velocity of about 5 x 108 cm s-1 and transits a molecule of 1 nm length in 2 x 10-16 s, while a typical bond vibration requires >10-12 s; thus, the molecular conformation remains unchanged as the electronic excitations occurs (Franck-Condon principle). The degree of fragmentation depends on the internal energy deposition in the molecular ion and on the resistance of the molecular structure to bond cleavage (fragmentation).
Disadvantages • Parent Identification. • Need Volatile Sample. • Need Thermal Stability. • No Interface to LC. • Low Mass Compounds (<1000 amu). • Solids Probe Requires Skilled Operator. • The need to volatilize the sample limits this method since it excludes analysis of thermally unstable compounds. • Excessive fragmentation can lead to the disappearance of the molecular ion peak therefore preventing the molecular mass of the analyte to be determined.
Types of MS Peaks: • Molecular (or Parent) Ion – ion having same mass as the analyte. • Daughter Ion – ion having lower mass • Base Peak – biggest peak • Size of peaks depends on relative natural abundance of isotopes • The base peak in electron-impact spectra arise from fragments rather than from molecular ion. • The molecular ion peak provides the MWt of the unknown. • In EI certain molecules yield no molecular ion peak.
Contrasting degrees of fragmentation depending on the chemical structure Radical cations of aromatic and unsaturated conjugated hydrocarbons resist fragmentation more than radical cations of saturated hydrocarbons.
Lowering the electron beam energy to approximately 15 eV does not necessarily result in the observation of a molecular ion. • CH3C=O++ • •OCH2CH2CH2CH3 • CH2=CHCH2CH3+ • + CH3COOH • It does, however, change the probability of different fragmentation pathways. Here, the H-rearrangement wins at the expense of single-bond cleavage.