Download
1 / 45
450 likes | 586 Views
2006 Public Opinion Survey on Education in Indiana. Presented to the Indiana State Board of Education January 3, 2007. Jonathan A. Plucker Terry E. Spradlin Jason S. Zapf Rosanne W. Chien. Center for Evaluation and Education Policy (CEEP).

E N D
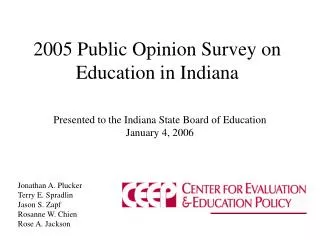
2006 Public Opinion Survey on Education in Indiana Presented to the Indiana State Board of Education January 3, 2007 Jonathan A. Plucker Terry E. Spradlin Jason S. Zapf Rosanne W. Chien
Center for Evaluation andEducation Policy (CEEP) • CEEP promotes and supports rigorous program evaluation and policy research primarily, but not exclusively, for education, human service and non-profit organizations. • In the area of K-12 education policy, CEEP’s mission is to help inform, influence and shape sound policy through effective, nonpartisan research and analysis.
Need for a Survey • No comprehensive, nonpartisan survey of public opinion on Indiana education issues in recent memory • Policymakers in other states find such surveys to be very helpful • Measure the impact of the changes in the education policy environment on the attitudes and perceptions of respondents • E.g., Gov. Daniels completing his second year in office, improving state finances, full implementation of several new laws and programs intended to improve public education • Year 4 survey conducted to identify changes in the attitudes and perceptions of Hoosiers since 2003 and gauge opinions on K-12 education policy issues likely to be addressed during the 2007 session of the Indiana General Assembly
Telephone Survey Sample • 612 residents of Indiana, all 18+ years old • Conducted in November 2006 • Random Digit Dialing (RDD) • Includes both listed and unlisted numbers • Minimum and maximum quotas for county, age, gender, and race/ethnicity to ensure a representative sample of these variables • Gender: 45.9% male, 54.1% female • Race: 80.3% white, 8.3% African American, 6.1% Hispanic • State and regional results are weighted proportionately to the Indiana population for gender and race • Phone survey and data collection conducted by Stone Research Services
Survey Statistics • Ratio of initial refusals to households successfully screened (1929/793) was 2.4:1, which is average for RDD samples. • Overall sampling error of +/- 4%
Survey Development • Questions developed from a review of: • Surveys in other states (AL, CA, DE, IL) and the ISTA poll • 38th Annual Phi Delta Kappa/Gallup Poll of the Public’s Attitudes Toward the Public Schools • Issues being discussed by Indiana policymakers • Anticipated “hot topics” in Indiana (e.g., full-day kindergarten, school funding, ISTEP+ testing, vouchers, and teacher compensation)
Item Revision • 2003-2006 Survey questions have been reviewed by: • Project staff • Indiana policymakers and educational leaders representing a breadth of perspectives and ideologies • Stone Research Services
Public School Quality (Q1) • 56% of Hoosiers said that public schools in Indiana provide an excellent or good education v. 31% fair and 10% poor • Only 39% of non-white respondents say that public schools provide an excellent or good education v. 60% of white respondents • 41% of non-white respondents said that schools provide a fair education and 16% of non-white respondents said poor • No significant difference between respondents with school-aged children and those without school-aged children • 63% of Southern IN residents rate schools excellent or good; highest among the three regions of the state 2003 2004 2005 2006
Public School QualityOver Past 5 Years (Q2) • 27% said that public schools have gotten better in the past 5 years, 44% the same, and 19% worse • 26% (better) v. 23% (worse) with school-aged children • 27% v. 19% without school-aged children • 30% of Southern Indiana residents say schools have gotten better v. 29% of Central IN, and 23% of Northern IN residents 2003 2004 2005 2006
Community School Quality (Q3) • 65% of Hoosiers said that schools in their community provide and excellent or good education v. 34% fair or poor • 66% (excellent/good) v. 34% (worse) with school-aged children • 64% v. 34% without school-aged children • 69% of white residents say schools in their community provide an excellent or good education v. 48% of minority residents 2003 2005 2006 2004
Community School Quality Over Past 5 Years (Q4) • 32% of Hoosiers said that schools in their community have gotten better, 46% the same, and 15% who believe they have gotten worse • 37% (better) v. 14% (worse) with school-aged children • 29% v. 18% without school-aged children • 35% of Central IN residents say their community schools have gotten better v. 31% of Southern IN, and 29% of Northern IN residents 2003 2005 2006 2003 2004
Impact of Spending on Quality of Education (Q5) • 80% indicated that the amount of money spent on public education affects the quality of education a lot or somewhat, v. 12% who indicate a little and 5% who said not at all • 80% (a lot/somewhat) v. 13% (not at all) with school-aged children • 79% v. 12% without school-aged children • 81% of white respondents v. 76% of minority residents 2005 2003 2004 2006
Is Public School FundingSufficient? (Q6A) • 61% of residents said the level of funding for public schools is not enough, 26% said it is enough, and 8% said the level of funding is more than enough • Men, individuals 65 and older, residents in Southern Indiana, and whites were the most likely to say funding levels are enough or more than enough, although all such responses were less than 50% • Women, residents in Central Indiana, and minority citizens were the most likely to say funding levels are insufficient. 2006 2003 2004 2005
Is Current Per Pupil Spending Sufficient? (Q6B) • When informed that the average per pupil expenditure was $10,000/student, 45% of residents said this amount was not enough, 35% enough, and 12% more than enough • Females, college graduates, citizens of Central Indiana, and non-white residents most frequently responded that this amount was not enough 2006
Expenditures on Facilities & Equipment (Q7) • Majority of Hoosiers (43%) expressed view spending is sufficient on facilities and equipment • 22% said expenditures are far too much or more than sufficient • 23% said expenditures are less than sufficient or far too little 2004 2005 2006
State Funding for Voluntary Pre-School for At-Risk Children (Q8) • Vast majority of Hoosiers (82%) expressed support state funding for pre-school programs for at-risk children • 85% with school aged children v. 80% without • 82% of white residents v. 81% of minority residents indicate support 2005 2006
Mandatory Kindergarten (Q9) • Vast majority of Hoosiers (75%) support mandatory kindergarten for all students • 78% with school-aged children v. 74% without • 83% of Southern IN residents, 74% of Central and Northern IN residents 2005 2006
State-Funded Full-Day Kindergarten (Q10) • Vast majority of Hoosiers (75%) support state-funded full-kindergarten • 78% with school-aged children v. 71% without • 82% of minority residents indicate support v. 72% of white residents • 80% of Central IN residents, 75% of Southern IN, and 65% of Northern IN residents 2006
Require All School Districts to Offer Full-Day Kindergarten (Q11) • Vast majority of Hoosiers (76%) support mandating school corporations to provide full-kindergarten • 80% with school-aged children v. 74% without • 86% of minority residents indicate support v. 74% of white residents • 80% of Central IN residents, 74% of Southern IN, and 71% of Northern IN residents indicate support 2006
Require All Students to Attend Full-Day Kindergarten (Q12) • 58% of Hoosiers support mandatory full-kindergarten • 64% with school-aged children v. 55% without • 75% of minority residents indicate support v. 54% of white residents • 62% of Central IN residents, 60% of Southern IN, and 52% of Northern IN residents indicate support 2006
Increase Taxes to Support Full-Day Kindergarten (Q13) • 61% of Hoosiers support increasing taxes to fund full-day kindergarten • 60% with school-aged children v. 62% without • 65% of minority residents indicated support v. 61% of white residents • 73% with a bachelor’s degree or higher indicate support, 60% with some college, and 51% with HS or less 2005 2004 2003 2006
Hoosiers Somewhat or Very Familiar With … (Q14, 21A) 2003 2004 2006 2005
ISTEP+ and SchoolPerformance (Q15) • 71% of Indiana residents believe ISTEP+ has improved schools to some extent v. 25% not at all • No difference between residents with school-aged children and those without (both 71%) 2003 2004 2005 2006
ISTEP+ Hold Schools Accountable for Student Achievement (Q16) • 72% of Hoosiers strongly or somewhat strongly agreed that ISTEP+ holds schools accountable for student achievement • 76% of respondents with school-aged children strongly agreed or agreed v. 69% without • 76% of minority respondents also strongly agreed or agreed v. 71% of white residents 2003 2004 2005 2006
ISTEP+ Gives Helpful Information About School Performance (Q17) • 67% of Hoosiers indicated that ISTEP+ provides helpful information to parents about school performance, down slightly from 73% in 2003 • 73% of respondents with school-aged children strongly agreed or agreed v. 63% without • 72% of minority respondents also strongly agreed or agreed v. 65% of white residents 2003 2004 2005 2006
ISTEP+ Gives Helpful Information About Student Performance (Q18) • 73% of Hoosiers indicated that ISTEP+ provides parents helpful information about student performance • 75% of respondents with school-aged children strongly agreed or agreed v. 71% without • 75% of minority respondents also strongly agreed or agreed v. 72% of white residents 2006
ISTEP+ Given in Fall or Spring (Q19) • 75% of Hoosiers indicated that the ISTEP+ should be given toward the end of the school year, up from 70% in 2005 • 12% of citizens preferred the start of the year and 11% felt the timing makes no difference 2006 2005
Options for Schools onAcademic Probation (Q20) • 61% of Indiana residents stated a preference for additional assistance to help improve student achievement • 18% would support state financial support to parents to offset part or all of the tuition for a private school • 15% preferred giving parents public school transfer authority 2006 Nationally 2006 2005
Creation of More Charter Schools (Q21B) • 47% of Hoosiers support the creation of more charter schools, down from 56% in 2004 and 54% in 2003 • Those in opposition to charters has increased from 20% in 2003 to 34% in 2006 • 50% of those with children in school favor more charter schools v. 46% of those without • 67% of minority residents favor more charter schools v. 43% of whites 2004 2005 2003 2006
Charter School With Majority of Instruction Provided Online (Q21C) • 76% of Indiana residents oppose a charter school with the majority of instruction provided over the Internet • 84% of those with a college degree or more oppose v. 65% of those with HS or less • 85% of those who earn $50K or more v. 64% of those who earn less than $50K per year • No significant differences by race, gender, or state region of residence 2006
Teacher Quality (Q22) • 71% rated the quality of public school teachers as excellent or good v. 23% who rated teacher quality as fair and 4% poor • 75% (excellent/good) v. 19% (fair) and 4% (poor) with school-aged children • 68% v. 29% without school-aged children • 74% of white residents (excellent/good) v. 58% of minority residents 2006 2005 2003 2004
Teacher Compensation (Q23) • 72% favor paying highly qualified teachers higher salaries to teach in schools identified as needing improvement or that have a high percentage of students living in poverty • 70% of males favor v. 74% of females • 77% of those with a college degree or more favor such a compensation system v. 67% of those with HS or less 2006 2005 2003 2004
Increases in Teacher Compensation (Q24) • 71% favor basing increases in teacher salaries on a combination of student performance, years of service, or training • 73% of whites favor v. 62% of minority residents • 66% of males v. 75% of females 2006 2005
Hoosiers That Know a Great Deal or Some About … (Q25, 28) 2004 Indiana 2003 Indiana 2005 Indiana 2006 Indiana 2006 Nationally
Impact of NCLB on Schools (Q26) • 40% of Hoosiers in 2006 indicated NCLB is helping the performance of schools compared to 26% nationally • 43% of those with school-aged children v. 37% without • 50% of minority v. 38% of whites 2006 2003 2005 2004 2006 Nationally
Judging School Performance (Q27) • 73% of Hoosiers favor using a combination of fixed standards and improvement in number of students passing the ISTEP+ to judge school performance 2006 2005
Impact of PL221 on Schools (Q29) • Of those expressing familiarity with PL 221, 48% indicate it is helping the performance of schools • 44% of those with school-aged children v. 50% without • 58% of minority v. 46% of whites 2006
Importance ofAchievement Gap (Q30) • 94% of respondents indicated closing the achievement gap is very or somewhat important • Non-white respondents indicated greater agreement that issue very important: • Non-white: 83% • White: 68% 2006 Indiana 2004 Indiana 2005 Indiana 2006 Nationally
Cause of Achievement Gap (Q31) • 76% of Hoosiers believe that the achievement gap is due to factors other than schooling, such as family income or parental educational attainment • Non-white and white respondents differ regarding the attribution to factors other than schooling: • White: 79% • Non-white: 64% 2006 Indiana 2004 Indiana 2005 Indiana 2006 Nationally
Closing the Achievement Gap (Q32) • 54% of Indiana residents believe it is the public schools’ responsibility to close the achievement gap; 39% believe it is not • 52% of non-white residents v. 55% of white residents 2004 Indiana 2006 Indiana 2005 Indiana 2006 Nationally
General Conclusions • Indiana adults generally have a positive attitude about public schools and teachers, especially in their own community. • However, citizens continue see room for improvement. • Minority residents generally have lower levels of satisfaction about public schools. • Trends on multi-year questions are generally consistent and fall within the sampling error of the survey.
2007 Survey • CEEP will explore continuation of the Public Opinion Survey on Education in Indiana in 2007. • If continued, questions will continue to be reviewed and refined.
CEEP Contact Information: Jonathan Plucker, Director Terry Spradlin, Assoc. Director of Education Policy 509 East Third Street Bloomington, Indiana 47401-3654 812-855-4438 1-800-511-6575 Fax: 812-856-5890 jplucker@indiana.edu http://ceep.indiana.edu IU School of Education