Download
1 / 10
100 likes | 105 Views
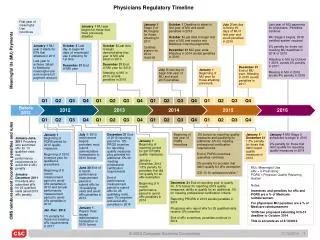
This community health survey analyzes the health decisions made by 269 individuals in the Thomas Jefferson Health District. Please note that this survey is not a statistical sample and may have limitations due to the population studied at UVA. The results suggest a potentially higher number of obese individuals compared to the general population. The survey covers various topics including demographics, housing, general health, harmful activities, health activities, access to food, access to healthcare, and aging in place.

E N D
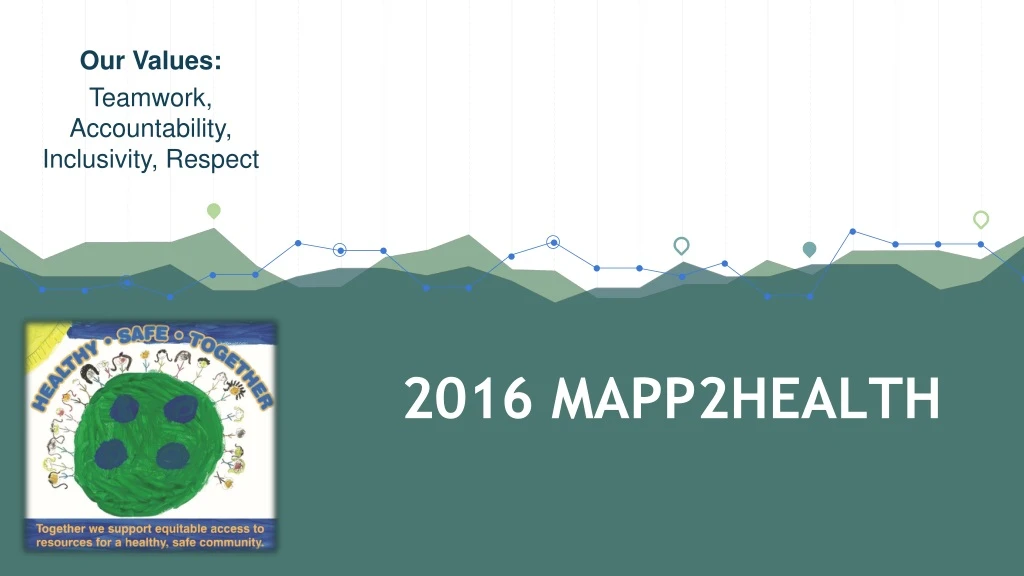
Our Values: Teamwork, Accountability, Inclusivity, Respect 2016 MAPP2HEALTH
BRFSS Making health decisions based on the results of 269 individuals
Limitations: • Not a statistical sample of the community • UVA a tertiary referral center: the sickest of the sick may go there • Result: perhaps greater number of obese individuals when compared to population
Statistical sample using a purchased, address-based sampling of households • Target: Adults in the Thomas Jefferson Health District • 43 questions on following topic areas • Demographics • Housing • General Health • Harm Activities • Health Activities • Access to Food • Access to Health Care • Aging in Place
Community Health Survey versus Census Race/Ethnicity Sex Age
Housing and Aging Live in single family home: 68% Own (with or without mortgage): 65% Worried/stressed about paying mortgage: 9% Like to be living in the community 5yrs from now: 79% Community is an excellent place to live: 58% Important to live independently in home as age: 90% Important to remain in community as age: 62% Length of time in the community
Access to Food *Sum of answers often and sometimes true ** Yes/No question