Download
1 / 8
80 likes | 525 Views
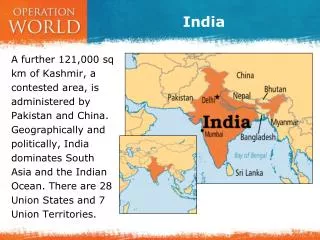
India . Economy. India’s GDP . At the end of 2011 India’s GDP was $ 4.463 trillion. India ranks number 4 out of 226 countries for GDP in 2011. Below is a graph of the United States GDP and India’s GDP over the last 3 years. . India’s Inflation .

E N D
India Economy
India’s GDP • At the end of 2011 India’s GDP was $4.463 trillion. • India ranks number 4 out of 226 countries for GDP in 2011. • Below is a graph of the United States GDP and India’s GDP over the last 3 years.
India’s Inflation • India’s inflation rate is relatively high at 6.8% in 2011. • India’s inflation rate ranks it as number 154 in the world. • The United States inflation rate ranks at number 57 in the world comparison chart.
India’s GDP Growth rate • India’s growth rate in 2011 was 7.8% which is a good growth rate placing India at number 15 in the world. • The United states growth rate was much lower at 1.5% placing it at number 172 in the world rating. • China continues to have a steady growth rate over the last 3 years, compared to US and India.
India’s Foreign Reserves • India has strong foreign reserves ranking at number 24 with the rest of the world. • On December 31st 2011 India’s Reserves of Foreign Exchange and Gold was $345.8 Billion • In 2009 India’s Foreign Reserves were $91.86 Billion. • India’s cash on hand supply is good.
India’s GDP per Capita • India has a very low per capita GDP. • In 2011 the per capita was $3700, comparing to the US at $48,1000 per capita. • This means that most of India’s population does not have enough money to purchase goods, in turn something like Costco probably would not do well in India, unless it was in wealthy region.
Currency Stability in India • The Indian Rupee exchange rate over the last 12 months is 47.83. • In the last ten years the average exchange rate of the US dollar to the Indian Rupee was 45.83 • Based on the trends over the last 12 months and the last 10 years, it seems that the rupee is fairly stable.
Conclusion • India has a strong growth rate and has been consistently growing over the last few years. • Although there is a strong growth rate in India, the per capita GDP shows that things are not spread evenly and most areas are not wealthy. • Costco probably would not have great success in India right now, but may when the per capita GDP raises.