Download
1 / 73
730 likes | 911 Views
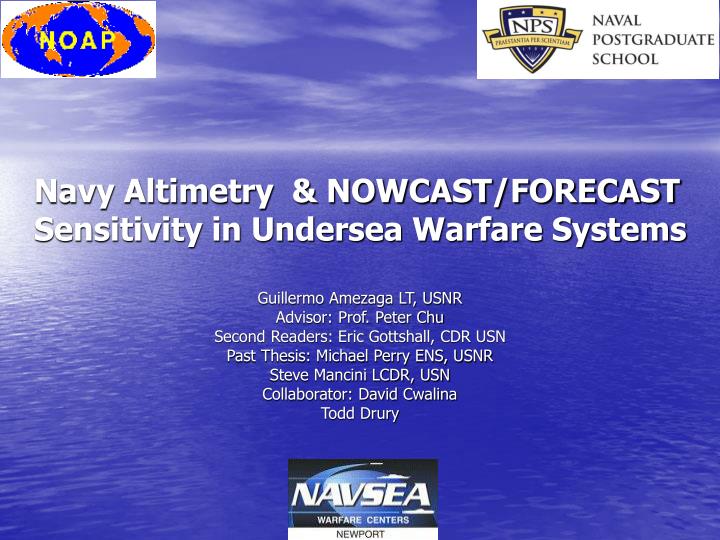
Navy Altimetry & NOWCAST/FORECAST Sensitivity in Undersea Warfare Systems. Guillermo Amezaga LT, USNR Advisor: Prof. Peter Chu Second Readers: Eric Gottshall, CDR USN Past Thesis: Michael Perry ENS, USNR Steve Mancini LCDR, USN Collaborator: David Cwalina Todd Drury. Past Thesis.

E N D
Navy Altimetry & NOWCAST/FORECAST Sensitivity in Undersea Warfare Systems Guillermo Amezaga LT, USNR Advisor: Prof. Peter Chu Second Readers: Eric Gottshall, CDR USN Past Thesis: Michael Perry ENS, USNR Steve Mancini LCDR, USN Collaborator: David Cwalina Todd Drury
Past Thesis • Michael Perry, June 2003 • GDEM vs MODAS with 3 altimeters • March 15, 2001 • 117 vs 1633 profiles • 35.0-40.0N • 70.0-75.0W • Area coverage is an effective metric for comparing weapon presets
Satellite SST & SSH MODAS WAPP Presets Satellite SST only Presets Past Thesis Process Flowchart (Mancini,2004) Relative Difference
WAPP Presets Presets Thesis Process Flowchartfor NOWCAST/FORECAST MODAS POM SCSMEX Relative Difference OBS
TPX MODAS WAPP Presets GFO Presets Thesis Process FlowchartNavy Altimetry Relative Difference
Area of Interest (AOI) • Taiwan • High Oceanographic variability • NE/SW Monsoon • Meso-scale (Eddies) • Typhoons • Tactical Significance • SCSMEX data availability • MODAS validation • POM validation • Hydrographic data availability
ECS SCS Taiwan (AOI) (From Laing et. al., 2001)
winter summer Snapshotof Variability (From Laing et. al., 2002) 100m depth 30m depth
Satellite orbitology GEOSAT Follow On (GFO) TOPEX (TPX) JAN 2001
Spatial Resolution Temporal Resolution TPX launched AUG 1992 Exact overhead repeat 10 days Orbit 1336 km 66 degree inclination Circular GFO launched FEB 1998 Exact overhead repeat 17 days Orbit 800 km 108 degree inclination 0.001 eccentricity
TPX GFO
Satellite orbitology GEOSAT Follow On (GFO) TOPEX (TPX) JUL 2001
GFO TPX
NOWCAST/FORECASTVALIDATION South China Sea Experiment (SCSMEX) validation of MODAS and POM
SCSMEX • SCSMEX was large scale multi-national experiment in the SCS • Main goal of gaining insight into the water and energy cycle of the Asian monsoon cycle (Chu et al, 2001) • SCSMEX provided a unique opportunity to evaluate both the POM and MODAS. • SCSMEX was conducted in the SCS from April through June 1998. • During SCSMEX, the oceanographic data set included 1742 CTD and mooring stations (Chu et al, 2001).
SCSMEX Observation • SCSMEX provided a unique opportunity to evaluate both the POM and MODAS • SCSMEX was conducted in the SCS from April through June 1998 • Oceanographic data set included 1742 CTD and mooring stations (Chu et al, 2001). (From Chu et. al., 2001)
Methodology of SCSMEX evaluation of MODAS • Both observational and climatology where used in the verification of the value added of MODAS (Chu et al, 2004) • The observational data was used as the benchmark to determine the error statistics for MODAS and climatology data. • MODAS has added value if the difference between MODAS and observational data is smaller than the difference between climatological and observational data. (Chu et al, 2004).
Methodology of SCSMEX evaluation of MODAS (POM) MODAS, climatology , and observational data are represented by (temperature, salinity). The difference in between MODAS and observational data is: And, the difference in between climatology and observational data is .
Methodology of SCSMEX evaluation of MODAS (POM) The bias , mean-square–error (MSE), and root-mean-square-error (RMSE) for MODAS , Where, N is the total number of horizontal points (Chu et al, 2004)
Results of SCSMEX evaluation of MODAS • “MODAS provides reasonably good temperature and salinity NOWCAST.” (Chu et. al., 2004) • Gaussian-type distribution of errors • Mean Temperature error nearly zero (deg C) • Mean Salinity error of -0.2 ppt • MODAS temperature NOWCAST better than salinity NOWCAST
Results of SCSMEX evaluation of MODAS (From Chu et. al., 2004)
Results of SCSMEX evaluation of POM • “POM without data assimilation has capability to predict circulation patterns, temperature fields reasonably well, but has no capability to predict salinity fields.” (Chu et. al., 2001) • POM errors for temperature have a Gaussian-type distribution • POM errors for salinity have a non-Gaussian type distribution • Data assimilation enhances POM HINDCAST performance • POM errors for BOTH temperature and salinity have Gaussian type distribution
MODAS is the US Navy’s premier dynamic climatology tool. MODAS provides the capability of modifying the historical climatology with remotely sensed SSH and SST Dynamic MODAS assimilates in situ measurements of the temperature and salinity by method known as Optimum Interpolation techniques (Fox et al 2002). The surface structure projected downward using empirical relationships of the historical data which relates both SST and SSH to the subsurface temperature (Fox et. al., 2002). POM is a general three dimensional gridded model that is time-dependent and utilizes primitive equations to model general circulation with realistic topography and a free surface (Chu et al, 2001). POM was specifically developed to model nonlinear processes and mesocale eddy phenomena. MODAS vs POM
Navy Altimetry requirements for MODAS and numerical models “A minimum of one instrument is required. With only one instrument, this data must be used in conjunction with systems such as MODAS and NRL Layered Ocean Model (NLOM).” (NRL/FR/7320 – 99-9696)
WAPP Presets Presets Process Flowchart MODAS POM SCSMEX Relative Difference OBS
Weapon’s Acoustic Preset Program (WAPP) Objectives • To Provide the Fleet with an On-Board Automated Interactive Means for Generating Mk 48 & Mk 48 ADCAP Acoustic Presets and Visualizing Torpedo Performance • Base Computations on In Situ Environmental, Tactical, Target, and Weapon Parameters • Track the Evolution of Weapon, Tactical, Target, and Environmental Models • Provide Interfaces to • Support Fleet Exercises, Training, and Program Deliveries
Data SourcesProjected Environment (NUWC, NPT, RI, 2005) Latitude/Longitude Date-Time Group DBDB-V v4.2 Level 2 Bottom Depth Shallow/Deep Water GDEM-V v3.0 Sound Speed Profile Sound Speed Profile HIE (SN v5.3) Open Water/MIZ/Ice Cover Under Ice SMGC v2.0 Historic Wind Speed Sea State BST v1.0 Bottom Sediment Type Bottom Type VSS v6.3 Volume Scattering Strength Profile
Generated Output • Percentage Area Coverage • ASUW and ASW Scenarios • Shallow, Mid, and Deep Search Bands • High and Low Doppler Targets • Values Normalized Over Acoustic Modes
Acoustic Preset ModuleRanked Listset • List Set of Search Depth/Pitch Angle/Laminar Distance/Effectiveness Values • List Set Ranked Based on Acoustic Coverage Effectiveness and Recommendation Made Accounting for Cavitations and Depth Separation • Laminar Distance Utilized in Weapon Order Generation for Gyro/RTE
Acoustic Preset Module Signal Excess Display • Signal Excess Selectable from Pull-Down Menu • Provide a Visual Interpretation of Mk 48 Acoustic Performance Over Depth Band of Target
5 Tactical Scenarios Evaluated • HD Deep ASW • LD Deep ASW • LD Shallow ASW • HD ASUW • LD ASUW
WAPP output for MODAS and POM Here, the subscripts m denotes MODAS and p denotes. (Manicini, 2004) The relative difference was calculated using statistical package, which produced absolute values of the relative differences (RD) in area coverage (AC) for the identical SD/SA combination generated by WAPP,
WAPP output for MODAS and POM MEAN= 18.04 STD= 7.76 MEAN= 12.08 STD= 5.51 Mean
Navy Altimetry Sensitivity GFO vs TPX JAN 2001
ECS SCS GFO TPX In January 2001, the orbital coverage by TPX for the ECS and SCS did not vary. The same orbital track was updated every ten-days. GFO orbital change every 17 days. GFO orbital track overlapped the TPX orbital track during the ten-day period of 21-31 January 2001.
Analysis of Input Data ECS JAN 05, 2001
Analysis of Input Data SCS JAN 05, 2001