Download
1 / 48
820 likes | 4.15k Views
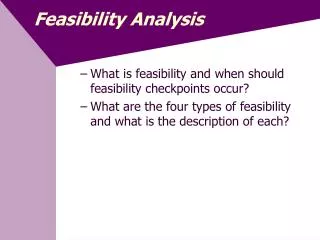
Feasibility Analysis - A Creeping Commitment Approach. Feasibility Checkpoints in the Life CycleFeasibility is the measure of how beneficial or practical the development of an information system will be to an organization.Feasibility analysis is the process by which feasibility is measured.Feasib

E N D
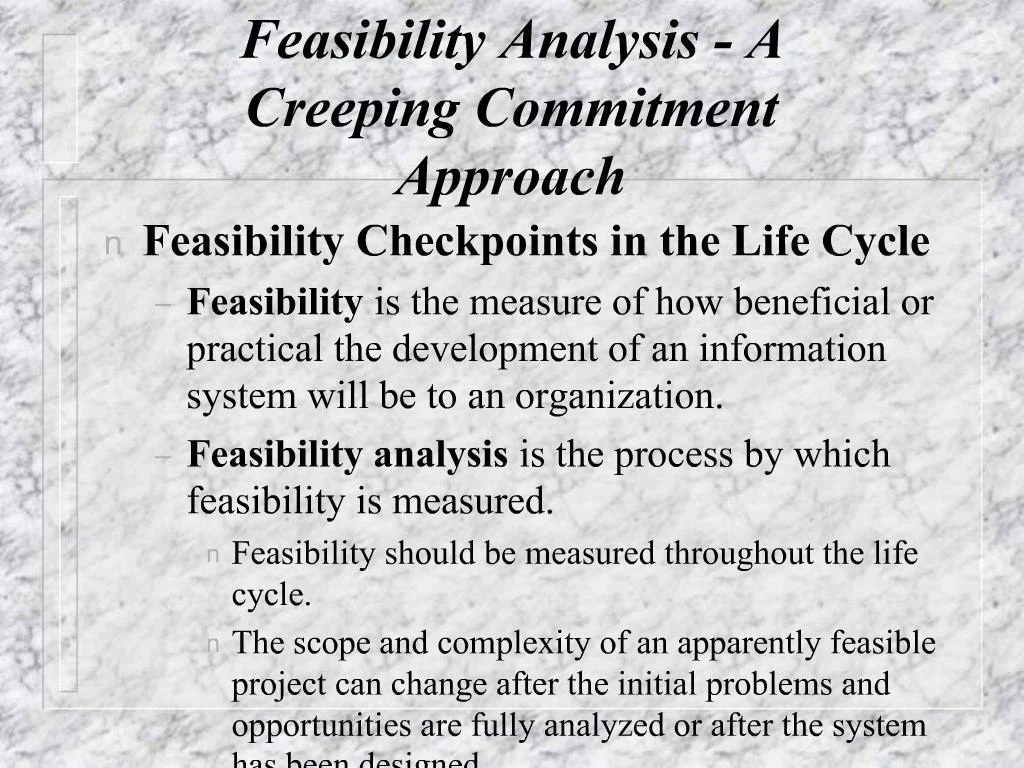
1. Feasibility Analysis - A Creeping Commitment Approach Feasibility Checkpoints in the Life Cycle
Feasibility is the measure of how beneficial or practical the development of an information system will be to an organization.
Feasibility analysis is the process by which feasibility is measured.
Feasibility should be measured throughout the life cycle.
The scope and complexity of an apparently feasible project can change after the initial problems and opportunities are fully analyzed or after the system has been designed.
Thus, a project that is feasible at one point in time may become infeasible at a later point in time. In today�s business world, it is becoming more and more apparent that analysts must learn to think like business managers. Computer applications are expanding at a record pace. Now more than ever, management expects information systems to pay for themselves. Information is a major capital investment that must be justified, just as marketing must justify a new product and manufacturing must justify a new plant or equipment. Systems Analysts are called on more than ever to help answer the following questions: Will the investment pay for itself? Are there other investments that will return even more on their expenditure?
This module deals with cost-benefit analysis and other feasibility issues of interest to the systems analyst and users of information systems. Few topics are more important. Feasibility analysis isn't really systems analysis, and it isn't systems design either. Instead, feasibility analysis is a cross life cycle activity and should be continuously performed throughout a systems project.
In today�s business world, it is becoming more and more apparent that analysts must learn to think like business managers. Computer applications are expanding at a record pace. Now more than ever, management expects information systems to pay for themselves. Information is a major capital investment that must be justified, just as marketing must justify a new product and manufacturing must justify a new plant or equipment. Systems Analysts are called on more than ever to help answer the following questions: Will the investment pay for itself? Are there other investments that will return even more on their expenditure?
This module deals with cost-benefit analysis and other feasibility issues of interest to the systems analyst and users of information systems. Few topics are more important. Feasibility analysis isn't really systems analysis, and it isn't systems design either. Instead, feasibility analysis is a cross life cycle activity and should be continuously performed throughout a systems project.
2. Feasibility Analysis - A Creeping Commitment Approach Feasibility Checkpoints in the Life Cycle
Feasibility is the measure of how beneficial or practical the development of an information system will be to an organization.
Feasibility analysis is the process by which feasibility is measured.
Feasibility should be measured throughout the life cycle.
The scope and complexity of an apparently feasible project can change after the initial problems and opportunities are fully analyzed or after the system has been designed.
Thus, a project that is feasible at one point in time may become infeasible at a later point in time. In today�s business world, it is becoming more and more apparent that analysts must learn to think like business managers. Computer applications are expanding at a record pace. Now more than ever, management expects information systems to pay for themselves. Information is a major capital investment that must be justified, just as marketing must justify a new product and manufacturing must justify a new plant or equipment. Systems Analysts are called on more than ever to help answer the following questions: Will the investment pay for itself? Are there other investments that will return even more on their expenditure?
This module deals with cost-benefit analysis and other feasibility issues of interest to the systems analyst and users of information systems. Few topics are more important. Feasibility analysis isn't really systems analysis, and it isn't systems design either. Instead, feasibility analysis is a cross life cycle activity and should be continuously performed throughout a systems project.
If you study your company's project standards or systems development life cycle (SDLC), you'll probably see a feasibility study phase or deliverable, but not an explicit ongoing process. But look more closely! Upon deeper examination, you'll probably identify various go/no-go checkpoints or management reviews. These checkpoints and reviews identify specific times during the life cycle when feasibility is reevaluated. A project can be canceled or revised in scope, schedule, or budget at any of these checkpoints. Thus, an explicit feasibility analysis phase in any life cycle should be considered to be only an initial feasibility assessment.In today�s business world, it is becoming more and more apparent that analysts must learn to think like business managers. Computer applications are expanding at a record pace. Now more than ever, management expects information systems to pay for themselves. Information is a major capital investment that must be justified, just as marketing must justify a new product and manufacturing must justify a new plant or equipment. Systems Analysts are called on more than ever to help answer the following questions: Will the investment pay for itself? Are there other investments that will return even more on their expenditure?
This module deals with cost-benefit analysis and other feasibility issues of interest to the systems analyst and users of information systems. Few topics are more important. Feasibility analysis isn't really systems analysis, and it isn't systems design either. Instead, feasibility analysis is a cross life cycle activity and should be continuously performed throughout a systems project.
If you study your company's project standards or systems development life cycle (SDLC), you'll probably see a feasibility study phase or deliverable, but not an explicit ongoing process. But look more closely! Upon deeper examination, you'll probably identify various go/no-go checkpoints or management reviews. These checkpoints and reviews identify specific times during the life cycle when feasibility is reevaluated. A project can be canceled or revised in scope, schedule, or budget at any of these checkpoints. Thus, an explicit feasibility analysis phase in any life cycle should be considered to be only an initial feasibility assessment.
3. Figure C.1 Feasibility Checkpoints in the Systems Development Lifecycle
Feasibility checkpoints can be installed into any SDLC that you are using. The figure above shows feasibility checkpoints for a typical life cycle (similar to, but not identical to, the life cycle used in this book). The checkpoints are represented by red diamonds. The diamonds indicate that a feasibility reassessment and management review should be conducted at the end of the prior phase (before the next phase). A project may be canceled or revised at any checkpoint, despite whatever resources have already been spent so far.
This idea may bother you at first. Your natural inclination may be to justify continuing a project based on the time and money you've already spent. Those costs are sunk. A fundamental principle of management is never to throw good money after bad � cut your losses and move on to a more feasible project. That doesn't mean the costs already spent are not important. As the minicase demonstrated, they must eventually be recovered if the investment is to ever be considered a success.
Figure C.1 Feasibility Checkpoints in the Systems Development Lifecycle
Feasibility checkpoints can be installed into any SDLC that you are using. The figure above shows feasibility checkpoints for a typical life cycle (similar to, but not identical to, the life cycle used in this book). The checkpoints are represented by red diamonds. The diamonds indicate that a feasibility reassessment and management review should be conducted at the end of the prior phase (before the next phase). A project may be canceled or revised at any checkpoint, despite whatever resources have already been spent so far.
This idea may bother you at first. Your natural inclination may be to justify continuing a project based on the time and money you've already spent. Those costs are sunk. A fundamental principle of management is never to throw good money after bad � cut your losses and move on to a more feasible project. That doesn't mean the costs already spent are not important. As the minicase demonstrated, they must eventually be recovered if the investment is to ever be considered a success.
4. Feasibility Analysis - A Creeping Commitment Approach Feasibility Checkpoints in the Life Cycle
Systems Analysis - A Survey Phase Checkpoint
At this early stage of the project, feasibility is rarely more than a measure of the urgency of the problem and the first-cut estimate of development costs.
It answers the question: ``Do the problems (or opportunities) warrant the cost of a detailed study of the current system?''
Realistically, feasibility can't be accurately measured until the problems (and opportunities) and requirements (definition phase) are better understood. After estimating benefits of solving the problems and opportunities, analysts will estimate costs of developing the expected system. Experienced analysts routinely increase these costs by 50 percent to 100 percent (or more) because experience tells them that the problems are rarely well-defined and that user requirements are typically understated.
After estimating benefits of solving the problems and opportunities, analysts will estimate costs of developing the expected system. Experienced analysts routinely increase these costs by 50 percent to 100 percent (or more) because experience tells them that the problems are rarely well-defined and that user requirements are typically understated.
5. Feasibility Analysis - A Creeping Commitment Approach Feasibility Checkpoints in the Life Cycle
Systems Analysis - A Study Phase Checkpoint
Because the problems are better understood, the analysts can make better estimates of development costs and of the benefits to be obtained from a new system.
The minimum value of solving a problem is equal to the cost of that problem.
Development costs, at this point, are still just guesstimates.
If the cost estimates significantly increase from the survey phase to the study phase, the likely culprit is scope.
Scope has a tendency to increase in many projects.
If increased scope threatens feasibility, then scope might be reduced. The minimum value of solving a problem is equal to the cost of that problem. For example, if inventory carrying costs are $35,000 over acceptable limits, then the minimum value of an acceptable information system would be $35,000. Hopefully, an improved system will be able to do better than that; however, it must return this minimum value!
The minimum value of solving a problem is equal to the cost of that problem. For example, if inventory carrying costs are $35,000 over acceptable limits, then the minimum value of an acceptable information system would be $35,000. Hopefully, an improved system will be able to do better than that; however, it must return this minimum value!
6. Feasibility Analysis - A Creeping Commitment Approach Feasibility Checkpoints in the Life Cycle
Systems Analysis - A Definition Phase Checkpoint
The next checkpoint occurs after the definition of user requirements for the new system.
These requirements frequently prove more extensive than originally stated.
For this reason, the analyst must frequently revise cost estimates for design and implementation.
Once again, feasibility is reassessed.
If feasibility is in question, scope, schedule, and costs must be rejustified. If early estimates were adjusted up, you may still be within the range despite an increase in scope. If not, the project need not always be canceled or reduced in scope. If you have kept track of the increase in problems and requirements since the beginning of the project, your system owner may be willing to pay for the increased requirements (and adjust the schedule accordingly).
If early estimates were adjusted up, you may still be within the range despite an increase in scope. If not, the project need not always be canceled or reduced in scope. If you have kept track of the increase in problems and requirements since the beginning of the project, your system owner may be willing to pay for the increased requirements (and adjust the schedule accordingly).
7. Feasibility Analysis - A Creeping Commitment Approach Feasibility Checkpoints in the Life Cycle
Systems Analysis - A Selection Phase Checkpoint
The selection phase represents a major feasibility analysis activity since it charts one of many possible implementations as the target for systems design.
During the selection phase, alternative solutions are defined in terms of their input/output methods, data storage methods, computer hardware and software requirements, processing methods, and people implications. No additional notes provided.No additional notes provided.
8. Feasibility Analysis - A Creeping Commitment Approach Feasibility Checkpoints in the Life Cycle
Systems Analysis - A Selection Phase Checkpoint
The following list presents the typical range of options that can be evaluated by the analyst.
Do nothing! Leave the current system alone.
Reengineer the (manual) business processes, not the computer-based processes.
Enhance existing computer processes.
Purchase a packaged application. Do nothing! Leave the current system alone. Regardless of management's opinion or your own opinion of this option, it should be considered and analyzed as a baseline option against which all others can and should be evaluated.
Reengineer the (manual) business processes, not the computer-based processes. This may involve streamlining activities, reducing duplication and unnecessary tasks, reorganizing office layouts, and eliminating redundant and unnecessary forms and processes, among others.
Do nothing! Leave the current system alone. Regardless of management's opinion or your own opinion of this option, it should be considered and analyzed as a baseline option against which all others can and should be evaluated.
Reengineer the (manual) business processes, not the computer-based processes. This may involve streamlining activities, reducing duplication and unnecessary tasks, reorganizing office layouts, and eliminating redundant and unnecessary forms and processes, among others.
9. Feasibility Analysis - A Creeping Commitment Approach Feasibility Checkpoints in the Life Cycle
Systems Analysis - A Selection Phase Checkpoint
The following list presents the typical range of options that can be evaluated by the analyst. (continued)
Design and construct a new computer-based system. This option presents numerous other options:
Centralized versus distributed versus cooperative processing
On-line versus batch processing
Files versus database for data storage
Of course, an alternative could be a combination of the preceding options.
After defining these options, each option is analyzed for operational, technical, schedule, and economic feasibility. No additional notes provided.
No additional notes provided.
10. Feasibility Analysis - A Creeping Commitment Approach Feasibility Checkpoints in the Life Cycle
Systems Analysis - A Procurement Phase Checkpoint
Because the procurement of hardware and applications software involves economic decisions that may require sizable outlays of cash, it shouldn't surprise you that feasibility analysis is required before a contract is extended to a vendor.
It should be noted that the procurement phase may be consolidated into the selection phase because hardware and software selection may have a significant impact on the feasibility of the solutions being considered. No additional notes provided.No additional notes provided.
11. Feasibility Analysis - A Creeping Commitment Approach Feasibility Checkpoints in the Life Cycle
Systems Analysis - A Design Phase Checkpoint
Because implementation is often the most time-consuming and costly phase, the checkpoint after design gives us one last chance to cancel or downsize the project.
Downsizing is the act of reducing the scope of the initial version of the system.
Future versions can address other requirements after the system goes into production. No additional notes provided.No additional notes provided.
12. Four Tests for Feasibility Most analysts agree that there are four categories of feasibility tests:
Operational feasibility is a measure of how well the solution of problems or a specific solution will work in the organization. It is also a measure of how people feel about the system/project.
Technical feasibility is a measure of the practicality of a specific technical solution and the availability of technical resources and expertise.
Schedule feasibility is a measure of how reasonable the project timetable is.
Economic feasibility is a measure of the cost-effectiveness of a project or solution. This is often called a cost-benefit analysis. Operational and technical feasibility criteria measure the worthiness of a problem or solution. Operational feasibility is people oriented. Technical feasibility is computer oriented.
Economic feasibility deals with the costs and benefits of the information system. Actually, few systems are infeasible. Instead, different options tend to be more or less feasible than others. Let's take a closer look at the four feasibility criteria.
Operational and technical feasibility criteria measure the worthiness of a problem or solution. Operational feasibility is people oriented. Technical feasibility is computer oriented.
Economic feasibility deals with the costs and benefits of the information system. Actually, few systems are infeasible. Instead, different options tend to be more or less feasible than others. Let's take a closer look at the four feasibility criteria.
13. Four Tests for Feasibility Operational Feasibility
Operational feasibility criteria measure the urgency of the problem (survey and study phases) or the acceptability of a solution (definition, selection, acquisition, and design phases).
There are two aspects of operational feasibility to be considered:
Is the problem worth solving, or will the solution to the problem work?
How do the end-users and management feel about the problem (solution)? No additional notes provided.No additional notes provided.
14. Four Tests for Feasibility Operational Feasibility
Is the Problem Worth Solving, or Will the Solution to the Problem Work?
PIECES can be used as the basis for analyzing the urgency of a problem or the effectiveness of a solution. The following is a list of the questions that address these issues:
Performance. Does the system provide adequate throughput and response time?
Information. Does the system provide end-users and managers with timely, pertinent, accurate, and usefully formatted information?
Economy. Does the system offer adequate service level and capacity to reduce the costs of the business or increase the profits of the business? No additional notes provided.No additional notes provided.
15. Four Tests for Feasibility Operational Feasibility
Is the Problem Worth Solving, or Will the Solution to the Problem Work?
PIECES can be used as the basis for analyzing the urgency of a problem or the effectiveness of a solution. The following is a list of the questions that address these issues: (continued)
Control. Does the system offer adequate controls to protect against fraud and embezzlement and to guarantee the accuracy and security of data and information?
Efficiency. Does the system make maximum use of available resources including people, time, flow of forms, minimum processing delays, and the like?
Services. Does the system provide desirable and reliable service to those who need it? Is the system flexible and expandable? No additional notes provided.No additional notes provided.
16. Four Tests for Feasibility Operational Feasibility
How do End-Users and Managers Feel about the Problem (Solution)?
It's not only important to evaluate whether a system can work but also evaluate whether a system will work.
A workable solution might fail because of end-user or management resistance. The following questions address this concern:
Does management support the system?
How do the end-users feel about their role in the new system?
What end-users or managers may resist or not use the system? People tend to resist change. Can this problem be overcome? If so, how? No additional notes provided.No additional notes provided.
17. Four Tests for Feasibility Operational Feasibility
How do End-Users and Managers Feel about the Problem (Solution)?
A workable solution might fail because of end-user or management resistance. The following questions address this concern: (continued)
How will the working environment of the end-users change? Can or will end-users and management adapt to the change? No additional notes provided.No additional notes provided.
18. Four Tests for Feasibility Operational Feasibility
Usability Analysis:
Usability analysis is often performed with a working prototype of the proposed system.
This is a test of the system�s user interfaces and is measured in how easy they are to learn, to use and support the desired productivity levels of the users.
The goal is to identify the areas of the system where the users are prone to make mistakes, processes which may be confusing or too complicated, and also observe the reactions of the user and assess their productivity. When determining operational feasibility in the later stages of the development life cycle, usability analysis is often performed with a working prototype of the proposed system.
Many large corporations, software consultant agencies and software development companies employ user interface specialists who specialize in designing and testing system user interfaces. They have special rooms equipped with video cameras, tape recorders, microphones and two-way mirrors in order to observe and record a user working with the system. Their goal is to identify the areas of the system where the users are prone to make mistakes, processes which may be confusing or too complicated, and also observe the reactions of the user and assess their productivity.
.When determining operational feasibility in the later stages of the development life cycle, usability analysis is often performed with a working prototype of the proposed system.
Many large corporations, software consultant agencies and software development companies employ user interface specialists who specialize in designing and testing system user interfaces. They have special rooms equipped with video cameras, tape recorders, microphones and two-way mirrors in order to observe and record a user working with the system. Their goal is to identify the areas of the system where the users are prone to make mistakes, processes which may be confusing or too complicated, and also observe the reactions of the user and assess their productivity.
.
19. Four Tests for Feasibility Operational Feasibility
Usability Analysis:
How do you determines if a system�s user interface is usable?
There are certain goals or criteria which experts agree help measure the usability of an interface and they are as follows:
Ease of Learning - How long does it take to train someone to perform at a desired level.
Ease Of Use - You are able to perform your activity quickly and accurately. If you are a first time user or infrequent user, the interface is easy and understandable. If you are a frequent user, your level of productivity and efficiency is increased.
Satisfaction - You the user are favorably pleased with the interface and prefer it over types you are familiar with. No additional notes provided.
.No additional notes provided.
.
20. Four Tests for Feasibility Technical Feasibility
Technical feasibility can only be evaluated after those phases during which technical issues are resolved � namely, after the evaluation and design phases of our life cycle have been completed.
Technical feasibility addresses three major issues:
Is the proposed technology or solution practical?
Do we currently possess the necessary technology?
Do we possess the necessary technical expertise, and is the schedule reasonable? No additional notes provided.No additional notes provided.
21. Four Tests for Feasibility Technical Feasibility
Is the Proposed Technology or Solution Practical?
The technology for any defined solution is normally available.
The question is whether that technology is mature enough to be easily applied to our problems.
Some firms like to use state-of-the-art technology, but most firms prefer to use mature and proven technology.
A mature technology has a larger customer base for obtaining advice concerning problems and improvements. No additional notes provided.No additional notes provided.
22. Four Tests for Feasibility Technical Feasibility
Do we Currently Possess the Necessary Technology?
Assuming the solution's required technology is practical:
``Is the technology available in the information systems shop?''
If the technology is available, does it have the capacity to handle the solution.
If the technology is not available:
``Can the technology be acquired?'' Assuming the solution's required technology is practical, we must next ask ourselves, ``Is the technology available in our information systems shop?'' If the technology is available, we must ask if we have the capacity. For instance, ``Will our current printer be able to handle the new reports and forms required of a new system?''
If the answer to either of these questions is no, then we must ask ourselves, ``Can we get this technology?'' The technology may be practical and available, and, yes, we need it. But we simply may not be able to afford it at this time. Although this argument borders on economic feasibility, it is truly technical feasibility. If we can't afford the technology, then the alternative that requires the technology is not practical and is technically infeasible!
Assuming the solution's required technology is practical, we must next ask ourselves, ``Is the technology available in our information systems shop?'' If the technology is available, we must ask if we have the capacity. For instance, ``Will our current printer be able to handle the new reports and forms required of a new system?''
If the answer to either of these questions is no, then we must ask ourselves, ``Can we get this technology?'' The technology may be practical and available, and, yes, we need it. But we simply may not be able to afford it at this time. Although this argument borders on economic feasibility, it is truly technical feasibility. If we can't afford the technology, then the alternative that requires the technology is not practical and is technically infeasible!
23. Four Tests for Feasibility Technical Feasibility
Do we Possess the Necessary Technical Expertise, and is the Schedule Reasonable?
We may have the technology, but that doesn't mean we have the skills required to properly apply that technology.
True, all information systems professionals can learn new technologies.
However, that learning curve will impact the technical feasibility of the project; specifically, it will impact the schedule. For instance, we may have a database management system (DBMS). However, the analysts and programmers available for the project may not know that DBMS well enough to properly apply it.
For instance, we may have a database management system (DBMS). However, the analysts and programmers available for the project may not know that DBMS well enough to properly apply it.
24. Four Tests for Feasibility Schedule Feasibility
Given our technical expertise, are the project deadlines reasonable?
Some projects are initiated with specific deadlines.
You need to determine whether the deadlines are mandatory or desirable.
If the deadlines are desirable rather than mandatory, the analyst can propose alternative schedules.
It is preferable (unless the deadline is absolutely mandatory) to deliver a properly functioning information system two months late than to deliver an error-prone, useless information system on time!
Missed schedules are bad.
Inadequate systems are worse! For instance, a project to develop a system to meet new government reporting regulations may have a deadline that coincides with when the new reports must be initiated. Penalties associated with missing such a deadline may make meeting it mandatory.
For instance, a project to develop a system to meet new government reporting regulations may have a deadline that coincides with when the new reports must be initiated. Penalties associated with missing such a deadline may make meeting it mandatory.
25. Four Tests for Feasibility Economic Feasibility
The bottom line in many projects is economic feasibility.
During the early phases of the project, economic feasibility analysis amounts to little more than judging whether the possible benefits of solving the problem are worthwhile.
As soon as specific requirements and solutions have been identified, the analyst can weigh the costs and benefits of each alternative.
This is called a cost-benefit analysis. No additional notes provided.No additional notes provided.
26. Four Tests for Feasibility The Bottom Line
You have learned that any alternative solution can be evaluated according to four criteria: operational, technical, schedule, and economic feasibility.
How do you pick the best solution? It's not always easy.
Operational and economic issues often conflict.
The final decision can only be made by sitting down with end-users, reviewing the data, and choosing the best overall alternative. For example, the solution that provides the best operational impact for the end-users may also be the most expensive and, therefore, the least economically feasible.
For example, the solution that provides the best operational impact for the end-users may also be the most expensive and, therefore, the least economically feasible.
27. Cost-Benefit Analysis Techniques How Much Will the System Cost?
Costs fall into two categories.
There are costs associated with developing the system.
Can be estimated from the outset of a project and should be refined at the end of each phase of the project.
There are costs associated with operating a system.
Can only be estimated once specific computer-based solutions have been defined (during the selection phase or later). Economic feasibility has been defined as a cost-benefit analysis. How do you estimate costs and benefits? And how do you compare those costs and benefits to determine economic feasibility? Most schools offer complete courses on these subjects � courses on Financial Management, Financial Decision Analysis, and Engineering Economics and Analysis. Such a course should be included in your plan of study. This section presents an overview of the techniques.Economic feasibility has been defined as a cost-benefit analysis. How do you estimate costs and benefits? And how do you compare those costs and benefits to determine economic feasibility? Most schools offer complete courses on these subjects � courses on Financial Management, Financial Decision Analysis, and Engineering Economics and Analysis. Such a course should be included in your plan of study. This section presents an overview of the techniques.
28. Cost-Benefit Analysis Techniques How Much Will the System Cost?
Systems development costs:
Are usually one-time costs that will not recur after the project has been completed.
Sample systems development costs:
Personnel costs
Computer usage
Training
Supply, duplication, and equipment costs.
Cost of any new computer equipment and software. Personnel costs � The salaries of systems analysts, programmers, consultants, data entry personnel, computer operators, secretaries, and the like who work on the project. Because many of these individuals spend time on many projects, their salaries should be prorated to reflect the time spent on the projects being estimated.
Computer usage � Computer time will be used for one or more of the following activities: programming, testing, conversion, word processing, maintaining a project dictionary, prototyping, loading new data files, and the like. If a computing center charges for usage of computer resources such as disk storage or report printing, the cost should be estimated.
Training � If computer personnel or end-users have to be trained, the training courses may incur expenses. Packaged training courses may be charged out on a flat fee per site, a student fee (such as $395 per student), or an hourly fee (such as $75 per class hour).
Personnel costs � The salaries of systems analysts, programmers, consultants, data entry personnel, computer operators, secretaries, and the like who work on the project. Because many of these individuals spend time on many projects, their salaries should be prorated to reflect the time spent on the projects being estimated.
Computer usage � Computer time will be used for one or more of the following activities: programming, testing, conversion, word processing, maintaining a project dictionary, prototyping, loading new data files, and the like. If a computing center charges for usage of computer resources such as disk storage or report printing, the cost should be estimated.
Training � If computer personnel or end-users have to be trained, the training courses may incur expenses. Packaged training courses may be charged out on a flat fee per site, a student fee (such as $395 per student), or an hourly fee (such as $75 per class hour).
29. Figure C.2 Costs for a Proposed System Solution
No additional notes provided.
Figure C.2 Costs for a Proposed System Solution
No additional notes provided.
30. Cost-Benefit Analysis Techniques How Much Will the System Cost?
The lifetime system benefits must recover both the developmental and operating costs.
Systems operating costs:
Recur throughout the lifetime of the system.
The costs of operating a system over its useful lifetime can be classified as fixed and variable.
Fixed costs occur at regular intervals but at relatively fixed rates. Examples of fixed operating costs include:
Lease payments and software license payments.
Prorated salaries of information systems operators and support personnel (although salaries tend to rise, the rise is gradual and tends not to change dramatically from month to month). Almost nobody forgets systems development budgets when itemizing costs. On the other hand, it is easy to forget that a system will incur costs after it has been placed into operation. Almost nobody forgets systems development budgets when itemizing costs. On the other hand, it is easy to forget that a system will incur costs after it has been placed into operation.
31. Cost-Benefit Analysis Techniques How Much Will the System Cost?
Systems operating costs:
Variable costs occur in proportion to some usage factor. Examples include:
Costs of computer usage (e.g., CPU time used, terminal connect time used, storage used) which vary with the work load.
Supplies (e.g., preprinted forms, printer paper used, punched cards, floppy disks, magnetic tapes, and other expendables), which vary with the work load.
Prorated overhead costs (e.g., utilities, maintenance, and telephone service).
After determining the costs and benefits for a possible solution, you can perform the cost-benefit analysis. No additional notes provided.
No additional notes provided.
32. Cost-Benefit Analysis Techniques What Benefits Will the System Provide?
Benefits normally increase profits or decrease costs, both highly desirable characteristics of a new information system.
To as great a degree as possible, benefits should be quantified in dollars and cents.
Benefits are classified as tangible or intangible.
Tangible benefits are those that can be easily quantified.
Tangible benefits are usually measured in terms of monthly or annual savings or of profit to the firm.
Examples include: fewer processing errors, reduced expenses, and increased sales. For example, consider the following scenario:
During the course of processing student housing applications, we discover that considerable data are being redundantly typed and filed. An analysis reveals that the same data is typed seven times, requiring an average of 44 additional minutes of clerical work per application. The office processes 1,500 applications per year. That means a total of 66,000 minutes or 1,100 hours of redundant work per year. If the average salary of a secretary is $6 per hour, the cost of this problem and the benefit of solving the problem is $6,600 per year.
For example, consider the following scenario:
During the course of processing student housing applications, we discover that considerable data are being redundantly typed and filed. An analysis reveals that the same data is typed seven times, requiring an average of 44 additional minutes of clerical work per application. The office processes 1,500 applications per year. That means a total of 66,000 minutes or 1,100 hours of redundant work per year. If the average salary of a secretary is $6 per hour, the cost of this problem and the benefit of solving the problem is $6,600 per year.
33. Cost-Benefit Analysis Techniques What Benefits Will the System Provide?
Benefits are classified as tangible or intangible. (continued)
Intangible benefits are those benefits believed to be difficult or impossible to quantify.
Examples include: improved customer goodwill and improved employee moral.
Unfortunately, if a benefit cannot be quantified, it is difficult to accept the validity of an associated cost-benefit analysis that is based on incomplete data. Suppose, for example, that improved customer goodwill is listed as a possible intangible benefit. Can we quantify goodwill? You might try the following analysis:
What is the result of customer ill will? The customer will submit fewer (or no) orders.
To what degree will a customer reduce orders? Your user may find it difficult to specifically quantify this impact. But you could try to have the end-user estimate the possibilities (or invent an estimate to which the end-user can react). For instance,
There is a 50 percent (.50) chance that the regular customer would send a few orders � fewer than 10 percent of all their orders -- to competitors to test their performance.
There is a 20 percent (.20) chance that the regular customer would send as many as half their orders (.50) to competitors, particularly those orders we are historically slow to fulfill.
There is a 10 percent (.10) chance that a regular customer would send us an order only as a last resort. That would reduce that customer's normal business with us to 10 percent of their current volume (90 percent or .90 loss).
There is a 5 percent (.05) chance that a regular customer would choose not to do business with us at all (100 percent or 1.00 loss).
We can calculate an estimated business loss as follows:
Loss = .50 x (.10 loss of business)
+.20 x (.50 loss of business)
+.10 x (.90 loss of business)
+.50 x (1.00 loss of business)
=.29
= 29% statistically estimated loss of business
If the average customer does $40,000 per year of business, then we can expect to lose 29 percent or $11,600 of that business. If we have 500 customers, this can be expected to amount to a total of $5,800,000.
Present this analysis to management, and use it as a starting point for quantifying the benefit.Suppose, for example, that improved customer goodwill is listed as a possible intangible benefit. Can we quantify goodwill? You might try the following analysis:
What is the result of customer ill will? The customer will submit fewer (or no) orders.
To what degree will a customer reduce orders? Your user may find it difficult to specifically quantify this impact. But you could try to have the end-user estimate the possibilities (or invent an estimate to which the end-user can react). For instance,
There is a 50 percent (.50) chance that the regular customer would send a few orders � fewer than 10 percent of all their orders -- to competitors to test their performance.
There is a 20 percent (.20) chance that the regular customer would send as many as half their orders (.50) to competitors, particularly those orders we are historically slow to fulfill.
There is a 10 percent (.10) chance that a regular customer would send us an order only as a last resort. That would reduce that customer's normal business with us to 10 percent of their current volume (90 percent or .90 loss).
There is a 5 percent (.05) chance that a regular customer would choose not to do business with us at all (100 percent or 1.00 loss).
We can calculate an estimated business loss as follows:
Loss = .50 x (.10 loss of business)
+.20 x (.50 loss of business)
+.10 x (.90 loss of business)
+.50 x (1.00 loss of business)
=.29
= 29% statistically estimated loss of business
If the average customer does $40,000 per year of business, then we can expect to lose 29 percent or $11,600 of that business. If we have 500 customers, this can be expected to amount to a total of $5,800,000.
Present this analysis to management, and use it as a starting point for quantifying the benefit.
34. Cost-Benefit Analysis Techniques Is the Proposed System Cost-Effective?
There are three popular techniques to assess economic feasibility, also called cost-effectiveness.
Payback analysis.
Return on investment.
Net present value.
One concept that should be applied to each technique is the adjustment of cost and benefits to reflect the time value of money. The choice of techniques should take into consideration the audiences that will use them. Virtually all managers who have come through business schools are familiar with all three techniques.
The choice of techniques should take into consideration the audiences that will use them. Virtually all managers who have come through business schools are familiar with all three techniques.
35. Cost-Benefit Analysis Techniques Is the Proposed System Cost-Effective?
The Time Value of Money:
A concept shared by all three techniques is the time value of money � a dollar today is worth more than a dollar one year from now.
Some of the costs of a system will be accrued after implementation.
All benefits of the new system will be accrued in the future.
Before cost-benefit analysis, these costs should be brought back to current dollars.
Why go to all this trouble?
Because projects are often compared against other projects that have different lifetimes. You could invest that dollar today and, through accrued interest, have more than one dollar a year from now. Thus, you'd rather have that dollar today than in one year. That's why your creditors want you to pay your bills promptly � they can't invest what they don't have.
An example should clarify the concept.
Suppose we are going to realize a benefit of $20,000 two years from now. What is the current dollar value of that $20,000 benefit? The current value of the benefit is the amount of money we would need to invest today to have $20,000 two years from now. If the current return on investments is running about 10 percent, an investment of $16,528 today would give us our $20,000 in two years (we'll show you how to calculate this later). Therefore, the current value of the estimated benefit is $16,528 � that is, we'd rather have $16,528 today than promise of $20,000 two years from now.
The same adjustment could be made on costs that are projected into the future. For example, suppose we are projecting a cost of $20,000 two years from now. What is the current dollar value of that $20,000 cost? The current value of the cost is the amount of money we would need to invest today to have $20,000 to pay the cost two years from now. Again, if we assume a 10 percent return on current investments, an investment of $16,528 today would give us the needed $20,000 in two years. Therefore, the current value of the estimated cost is $16,528 � that is, we can fulfill our cost obligation of $20,000 in two years by investing $16,528 today.
Time value analysis techniques have become the preferred cost-benefit methods for most managers. By time-adjusting costs and benefits, you can improve the cost-benefit techniques.You could invest that dollar today and, through accrued interest, have more than one dollar a year from now. Thus, you'd rather have that dollar today than in one year. That's why your creditors want you to pay your bills promptly � they can't invest what they don't have.
An example should clarify the concept.
Suppose we are going to realize a benefit of $20,000 two years from now. What is the current dollar value of that $20,000 benefit? The current value of the benefit is the amount of money we would need to invest today to have $20,000 two years from now. If the current return on investments is running about 10 percent, an investment of $16,528 today would give us our $20,000 in two years (we'll show you how to calculate this later). Therefore, the current value of the estimated benefit is $16,528 � that is, we'd rather have $16,528 today than promise of $20,000 two years from now.
The same adjustment could be made on costs that are projected into the future. For example, suppose we are projecting a cost of $20,000 two years from now. What is the current dollar value of that $20,000 cost? The current value of the cost is the amount of money we would need to invest today to have $20,000 to pay the cost two years from now. Again, if we assume a 10 percent return on current investments, an investment of $16,528 today would give us the needed $20,000 in two years. Therefore, the current value of the estimated cost is $16,528 � that is, we can fulfill our cost obligation of $20,000 in two years by investing $16,528 today.
Time value analysis techniques have become the preferred cost-benefit methods for most managers. By time-adjusting costs and benefits, you can improve the cost-benefit techniques.
36. Cost-Benefit Analysis Techniques Is the Proposed System Cost-Effective?
Payback Analysis:
The payback analysis technique is a simple and popular method for determining if and when an investment will pay for itself.
Because systems development costs are incurred long before benefits begin to accrue, it will take some period of time for the benefits to overtake the costs.
After implementation, you will incur additional operating expenses that must be recovered.
Payback analysis determines how much time will lapse before accrued benefits overtake accrued and continuing costs.
This period of time is called the payback period. No additional notes provided.No additional notes provided.
37. Cost-Benefit Analysis Techniques Is the Proposed System Cost-Effective?
Payback Analysis:
How do you determine the payback period?
Adjust the costs and benefits for the time value of money (that is, adjust them to current dollar values).
The present value of a dollar in year n depends on something typically called a discount rate.
The discount rate is a percentage similar to interest rates that you earn on your savings account.
The discount rate for a business is the opportunity cost of being able to invest money in other projects. No additional notes provided.No additional notes provided.
38. Cost-Benefit Analysis Techniques Is the Proposed System Cost-Effective?
Payback Analysis:
How do you determine the payback period? (continued)
The current value, actually called the present value, of a dollar at any time in the future can be calculated using the following formula:
PVn = 1(1 + i)n
where PVn is the present value of $1.00 n years from now and i is the discount rate.
Determine time period when lifetime benefits will overtake the lifetime costs.
This is the break-even point. Let's say that the discount rate for our sample company is 12 percent. The current value, actually called the present value, of a dollar at any time in the future can be calculated using the following formula:
PVn = 1(1 + i)n
where PVn is the present value of $1.00 n years from now and i is the discount rate.
Therefore, the present value of a dollar two years from now is
PV2 = 1(1 + .12)2 = 0.797
Does that bother you? Earlier we stated that a dollar today is worth more than a dollar a year from now. But it looks as if it is worth less, no? This is an illusion. The present value is interpreted as follows. If you have 79.7 cents today, it is better than having 79.7 cents two years from now. How much better? Exactly 20.3 cents better since that 79.7 cents would grow into one dollar in two years (assuming our 12 percent discount rate).
Many companies have a payback period guideline for all investments. In the absence of such a guideline, you need to determine a reasonable guideline before you determine the payback period.
It should be noted that you can perform payback analysis without time-adjusting the costs and benefits. The result, however, would show a 2.8-year payback that looks more attractive than the 3.5-year payback that we calculated. Thus, non-time-adjusted paybacks tend to be overoptimistic and misleading.Let's say that the discount rate for our sample company is 12 percent. The current value, actually called the present value, of a dollar at any time in the future can be calculated using the following formula:
PVn = 1(1 + i)n
where PVn is the present value of $1.00 n years from now and i is the discount rate.
Therefore, the present value of a dollar two years from now is
PV2 = 1(1 + .12)2 = 0.797
Does that bother you? Earlier we stated that a dollar today is worth more than a dollar a year from now. But it looks as if it is worth less, no? This is an illusion. The present value is interpreted as follows. If you have 79.7 cents today, it is better than having 79.7 cents two years from now. How much better? Exactly 20.3 cents better since that 79.7 cents would grow into one dollar in two years (assuming our 12 percent discount rate).
Many companies have a payback period guideline for all investments. In the absence of such a guideline, you need to determine a reasonable guideline before you determine the payback period.
It should be noted that you can perform payback analysis without time-adjusting the costs and benefits. The result, however, would show a 2.8-year payback that looks more attractive than the 3.5-year payback that we calculated. Thus, non-time-adjusted paybacks tend to be overoptimistic and misleading.
39. Figure C.3 Payback Analysis for a Project
In figure above we see an information system that will be developed at a cost of $418,040. The estimated net operating costs for each of the next six years are also recorded in the table. The estimated net benefits over the same six operating years are also shown. What is the payback period?
To determine the present value of any cost or benefit in year 2, you simply multiply 0.797 times the estimated cost or benefit. For example, the estimated operating expense in year 2 is $16,000. The present value of this expense if $16,000 x 0.797 or $12,752 (rounded up).
Fortunately, you don't have to calculate discount factors. There are tables similar to the partial one shown in figure C.4 on page 654 of textbook that show the present value of a dollar for different time periods and discount rates. Simply multiply this number times the estimated cost or benefit to get the present value of that cost or benefit. The authors apologize that this figure is not available at this time.
Now that we've discounted the costs and benefits, we can complete our payback analysis. Look at the cumulative lifetime costs and benefits. The lifetime costs are gradually increasing over the six-year period because operating costs are being incurred. But also notice that the lifetime benefits are accruing at a much faster pace. Lifetime benefits will overtake the lifetime costs between years 3 and 4. By charting the cumulative lifetime time-adjusted costs + benefits, we can estimate that the break-even point (when costs + benefits = 0) will occur approximately 3.5 years after the system has been placed into operation.
Is this information system a good or bad investment? It depends! Suppose that the guideline states that all investments must have a payback period less than or equal to four years. Because our example has a payback period of 3.5 years, it is a good investment. If the payback period for the system were greater than four years, the information system would be a bad investment.Figure C.3 Payback Analysis for a Project
In figure above we see an information system that will be developed at a cost of $418,040. The estimated net operating costs for each of the next six years are also recorded in the table. The estimated net benefits over the same six operating years are also shown. What is the payback period?
To determine the present value of any cost or benefit in year 2, you simply multiply 0.797 times the estimated cost or benefit. For example, the estimated operating expense in year 2 is $16,000. The present value of this expense if $16,000 x 0.797 or $12,752 (rounded up).
Fortunately, you don't have to calculate discount factors. There are tables similar to the partial one shown in figure C.4 on page 654 of textbook that show the present value of a dollar for different time periods and discount rates. Simply multiply this number times the estimated cost or benefit to get the present value of that cost or benefit. The authors apologize that this figure is not available at this time.
Now that we've discounted the costs and benefits, we can complete our payback analysis. Look at the cumulative lifetime costs and benefits. The lifetime costs are gradually increasing over the six-year period because operating costs are being incurred. But also notice that the lifetime benefits are accruing at a much faster pace. Lifetime benefits will overtake the lifetime costs between years 3 and 4. By charting the cumulative lifetime time-adjusted costs + benefits, we can estimate that the break-even point (when costs + benefits = 0) will occur approximately 3.5 years after the system has been placed into operation.
Is this information system a good or bad investment? It depends! Suppose that the guideline states that all investments must have a payback period less than or equal to four years. Because our example has a payback period of 3.5 years, it is a good investment. If the payback period for the system were greater than four years, the information system would be a bad investment.
40. Cost-Benefit Analysis Techniques Is the Proposed System Cost-Effective?
Return-on-Investment Analysis:
The return-on-investment (ROI) analysis technique compares the lifetime profitability of alternative solutions or projects.
The ROI for a solution or project is a percentage rate that measures the relationship between the amount the business gets back from an investment and the amount invested.
The ROI for a potential solution or project is calculated as follows:
ROI = (Estimated lifetime benefits - Estimated lifetime costs) / Estimated lifetime costs
The solution offering the highest ROI is the best alternative. Let's calculate the ROI for the same systems solution we used in our discussion of payback analysis. Once again, all costs and benefits should be time-adjusted. The time-adjusted costs and benefits were presented in rows 9 and 16 of Figure C.3. The estimated lifetime benefits minus estimated lifetime costs equals
$795,440 - $488,692 = $306,748
Therefore, the ROI is
ROI = $306,748/$488,692 = .628 = 63%
This is a lifetime ROI, not an annual ROI. Simple division by the lifetime of the system yields an average ROI of 10.5 percent per year. This solution can be compared with alternative solutions. The solution offering the highest ROI is the best alternative. However, as was the case with payback analysis, the business may set a minimum acceptable ROI for all investments. If none of the alternative solutions meets or exceeds that minimum standard, then none of the alternatives is economically feasible.
We could have calculated the ROI without time-adjusting the costs and benefits. This would, however, result in a misleading 129.4 percent lifetime or a 21.6 percent annual ROI. Consequently, we recommend time-adjusting all costs and benefits to current dollars.
Let's calculate the ROI for the same systems solution we used in our discussion of payback analysis. Once again, all costs and benefits should be time-adjusted. The time-adjusted costs and benefits were presented in rows 9 and 16 of Figure C.3. The estimated lifetime benefits minus estimated lifetime costs equals
$795,440 - $488,692 = $306,748
Therefore, the ROI is
ROI = $306,748/$488,692 = .628 = 63%
This is a lifetime ROI, not an annual ROI. Simple division by the lifetime of the system yields an average ROI of 10.5 percent per year. This solution can be compared with alternative solutions. The solution offering the highest ROI is the best alternative. However, as was the case with payback analysis, the business may set a minimum acceptable ROI for all investments. If none of the alternative solutions meets or exceeds that minimum standard, then none of the alternatives is economically feasible.
We could have calculated the ROI without time-adjusting the costs and benefits. This would, however, result in a misleading 129.4 percent lifetime or a 21.6 percent annual ROI. Consequently, we recommend time-adjusting all costs and benefits to current dollars.
41. Cost-Benefit Analysis Techniques Is the Proposed System Cost-Effective?
Net Present Value:
The net present value of an investment alternative is considered the preferred cost-benefit technique by many managers.
Costs are represented by negative cash flows while benefits are represented by positive cash flows.
After discounting all costs and benefits, subtract the sum of the discounted costs from the sum of the discounted benefits to determine the net present value.
If it is positive, the investment is good.
If negative, the investment is bad.
When comparing multiple solutions or projects, the one with the highest positive net present value is the best investment. No additional notes provided.No additional notes provided.
42. Figure C.5 Net Present Value Analysis for a Project
The figure above illustrates the net present value technique. Costs are represented by negative cash flows while benefits are represented by positive cash flows. We have brought all costs and benefits for our example back to present value. Notice again that the discount rate for year 0 (used to accumulate all development costs) is 1.000 because the present value of a dollar in year 0 is exactly $1.
After discounting all costs and benefits, subtract the sum of the discounted costs from the sum of the discounted benefits to determine the net present value. If it is positive, the investment is good. If negative, the investment is bad. When comparing multiple solutions or projects, the one with the highest positive net present value is the best investment. (Note: This even works if the alternatives have different lifetimes!) In our example the solution being evaluated yields a net present value of $306,748. This means that if we invest $306,748 at 12 percent for six years, we will make the same profit that we'd make by implementing this information systems solution. This is a good investment provided no other alternative has a net present value greater than $306,748.Figure C.5 Net Present Value Analysis for a Project
The figure above illustrates the net present value technique. Costs are represented by negative cash flows while benefits are represented by positive cash flows. We have brought all costs and benefits for our example back to present value. Notice again that the discount rate for year 0 (used to accumulate all development costs) is 1.000 because the present value of a dollar in year 0 is exactly $1.
After discounting all costs and benefits, subtract the sum of the discounted costs from the sum of the discounted benefits to determine the net present value. If it is positive, the investment is good. If negative, the investment is bad. When comparing multiple solutions or projects, the one with the highest positive net present value is the best investment. (Note: This even works if the alternatives have different lifetimes!) In our example the solution being evaluated yields a net present value of $306,748. This means that if we invest $306,748 at 12 percent for six years, we will make the same profit that we'd make by implementing this information systems solution. This is a good investment provided no other alternative has a net present value greater than $306,748.
43. Feasibility Analysis of Candidate Systems Candidate Systems Matrix
The candidate systems matrix documents similarities and differences between candidate systems; however, it offers no analysis.
The columns of the matrix represent candidate solutions.
The rows of the matrix represent characteristics that serve to differentiate the candidates. The breakdown is as follows:
TECHNOLOGY
INTERFACES
DATA
PROCESSES
GEOGRAPHY During the systems selection and procurement phases of systems design, the systems analyst identifies candidate system solutions and then analyzes those solutions for feasibility. We discussed the criteria and techniques for analysis in this chapter. In this concluding section we evaluate a pair of documentation techniques that can greatly enhance the comparison and contrast of candidate system solutions. Both use a matrix format. We have found these matrices useful for presenting candidates and recommendations to management.
The rows of the matrix represent characteristics that serve to differentiate the candidates. The breakdown is as follows:
TECHNOLOGY � Brief description of the technical solution represented by the candidate system.
INTERFACES � Identify how the system will interact with people and other systems.
DATA � How will data stores be implemented (e.g., conventional files, relational database(s), other database structures)? How will inputs be captured (e.g., on-line, batch, etc.)? How will outputs be generated (e.g., on a schedule, on demand, printed, on screen, etc.)?
PROCESSES � How will (manual) business processes be modified? How will computer processes be implemented? For the latter, we have numerous options, including on-line versus batch processes and packaged versus built-in-house software.
GEOGRAPHY � How will processes and data be distributed? Once again, we might consider several alternatives � for example, centralized versus decentralized versus distributed (or duplicated) versus cooperative (client/server) solutions.During the systems selection and procurement phases of systems design, the systems analyst identifies candidate system solutions and then analyzes those solutions for feasibility. We discussed the criteria and techniques for analysis in this chapter. In this concluding section we evaluate a pair of documentation techniques that can greatly enhance the comparison and contrast of candidate system solutions. Both use a matrix format. We have found these matrices useful for presenting candidates and recommendations to management.
The rows of the matrix represent characteristics that serve to differentiate the candidates. The breakdown is as follows:
TECHNOLOGY � Brief description of the technical solution represented by the candidate system.
INTERFACES � Identify how the system will interact with people and other systems.
DATA � How will data stores be implemented (e.g., conventional files, relational database(s), other database structures)? How will inputs be captured (e.g., on-line, batch, etc.)? How will outputs be generated (e.g., on a schedule, on demand, printed, on screen, etc.)?
PROCESSES � How will (manual) business processes be modified? How will computer processes be implemented? For the latter, we have numerous options, including on-line versus batch processes and packaged versus built-in-house software.
GEOGRAPHY � How will processes and data be distributed? Once again, we might consider several alternatives � for example, centralized versus decentralized versus distributed (or duplicated) versus cooperative (client/server) solutions.
44. Figure C.6 Candidate Systems Matrix Template
No additional notes provided.
Figure C.6 Candidate Systems Matrix Template
No additional notes provided.
45. Figure C.7 Sample Candidate Systems Matrix
Before considering any solutions, we must consider any constraints on solutions. Solution constraints take the form for architectural decisions intended to bring order and consistency to applications. For example, a technology architecture may restrict solutions to relational databases or client/server networks.
A sample, partially completed candidate system matrix listing three of the five candidates is shown in the figure above. The matrix is used to provide overview characteristics concerning the portion of the system to be computerized, the business benefits, and software tools and/or applications needed. Subsequent pages would provide additional details concerning other characteristics such as those mentioned previously. Two columns can be similar except for their entries in one or two cells. Multiple pages would be used if we were considering more than three candidates.
Figure C.7 Sample Candidate Systems Matrix
Before considering any solutions, we must consider any constraints on solutions. Solution constraints take the form for architectural decisions intended to bring order and consistency to applications. For example, a technology architecture may restrict solutions to relational databases or client/server networks.
A sample, partially completed candidate system matrix listing three of the five candidates is shown in the figure above. The matrix is used to provide overview characteristics concerning the portion of the system to be computerized, the business benefits, and software tools and/or applications needed. Subsequent pages would provide additional details concerning other characteristics such as those mentioned previously. Two columns can be similar except for their entries in one or two cells. Multiple pages would be used if we were considering more than three candidates.
46. Feasibility Analysis of Candidate Systems Feasibility Analysis Matrix
This matrix complements the candidate systems matrix with an analysis and ranking of the candidate systems. It is called a feasibility analysis matrix.
The columns of the matrix correspond to the same candidate solutions as shown in the candidate systems matrix.
Some rows correspond to the feasibility criteria presented in this chapter.
Rows are added to describe the general solution and a ranking of the candidates.
The cells contain the feasibility assessment notes for each candidate. Be careful. Not all feasibility criteria are necessarily equal in importance. Before assigning final rankings, you can quickly eliminate any candidates for which any criteria is deemed ``infeasible.'' In reality, this doesn't happen very often.
Be careful. Not all feasibility criteria are necessarily equal in importance. Before assigning final rankings, you can quickly eliminate any candidates for which any criteria is deemed ``infeasible.'' In reality, this doesn't happen very often.
47. Feasibility Analysis of Candidate Systems Feasibility Analysis Matrix
Each row can be assigned a rank or score for each criteria (e.g., for operational feasibility, candidates can be ranked 1, 2, 3, etc.).
After ranking or scoring all candidates on each criteria, a final ranking or score is recorded in the last row. Be careful. Not all feasibility criteria are necessarily equal in importance. Before assigning final rankings, you can quickly eliminate any candidates for which any criteria is deemed ``infeasible.'' In reality, this doesn't happen very often.
Be careful. Not all feasibility criteria are necessarily equal in importance. Before assigning final rankings, you can quickly eliminate any candidates for which any criteria is deemed ``infeasible.'' In reality, this doesn't happen very often.
48. Figure C.8 Feasibility Analysis Matrix Template
No additional notes provided.
Figure C.8 Feasibility Analysis Matrix Template
No additional notes provided.
49. Figure C.9 Sample Feasibility Analysis Matrix
A completed feasibility analysis matrix is presented in the figure above. The feasibility assessment is provided for each candidate solution. In this example, a score is recorded directly in the cell for each candidate's feasibility criteria assessment. Again, this matrix format can be most useful for defending your recommendations to management.
Figure C.9 Sample Feasibility Analysis Matrix
A completed feasibility analysis matrix is presented in the figure above. The feasibility assessment is provided for each candidate solution. In this example, a score is recorded directly in the cell for each candidate's feasibility criteria assessment. Again, this matrix format can be most useful for defending your recommendations to management.