Download
1 / 22
240 likes | 1.2k Views
CZECH TECHNICAL UNIVERSITY IN PRAGUE FACULTY OF BIOMEDICAL ENGINEERING . Absorption, Excitation and Emission Spectra, Quantum Yield. Martin Hof, Radek Mach á ň. Emission of light - Luminescence.

E N D
CZECH TECHNICAL UNIVERSITY IN PRAGUE FACULTY OF BIOMEDICAL ENGINEERING Absorption, Excitation and Emission Spectra, Quantum Yield Martin Hof, Radek Macháň
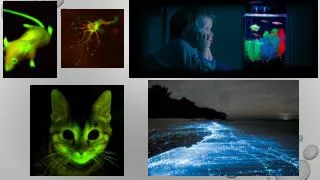
Emission of light - Luminescence Luminescence – the excess of light emitted above thermal radiation. The emission follows after the molecule has resided for some time in the excited state. according to excitation mechanism: photoluminescence – absorption of light chemiluminescence – chemical reaction thermoluminescence – heat electroluminescence – electric current … fluorescence phosphorescence photoluminescence – absorption of light
The discovery and characterization of luminescence Nicolás Monardes (1577), a Spanish physician and botanist who wrote on medicines of the New World, was the first to describe the bluish opalescence of the water infusion from the wood of a small Mexican tree. When made into cups and filled with water, a peculiar blue tinge was observed. This wood was very popular in XVI - XVII Europe, where it was known as "Lignum nephriticum" (kidney wood), because of its medicinal virtues for treating kidney ailments. In the ensuing centuries the wood was no longer used and the botanic identity of the LN was lost in a confusion of several species. Safford, in 1915, succeeded in disentangling the botanic problem and identified the species which produced the Mexican LN as Eynsemhardtia polystachia. More recently, several highly fluorescent glucosyl-hydroxichalcones were isolated from this plant.
Robert Boyle (1664)was inspired by Monardes’ report and investigated this system more fully. He discovered that addition of acid abolished the color and that addition of alkali brought it back. Hence Boyle was the first to use fluorescence as a pH indicator! Sir John Herschel (1845) made the first observation of fluorescence from quinine sulfate Sir George Stokes(1852)created the term “Fluorescence”. Stokes used a prism to obtain the ultraviolet region of the solar spectrum ( < 400 nm) to illuminate a quinine solution and observed the emission through a stained glass filter (> 400 nm; blocks the excitation light). This observations led Stokes to proclaim that fluorescence is of longer wavelength than the exciting light, which led to this displacement being called the Stokes Shift
Adolph Von Beyer (1871) a German chemist, synthesized Spiro[isobenzofuran-1(3H),9'-[9H]xanthen]-3-one, 3',6'-dihydroxy. FLUORESCEIN!!! R. Meyer (1897) used the term “fluorophore” to describe chemical groups which tended to be associated with fluorescence; this word was analogous to “chromophore” which was first used in 1876 by O.N. Witt to describe groups associated with color. Gregorio Weber (1952)synthesized dansyl chloride for attachment to proteins and used polarization to study protein hydrodynamics - these studies initiated the field of quantitative biological fluorescence. Shimomura, Johnson and Saiga (1962)discovered Green Fluorescent Protein in the Aequorea jellyfish
Fluorescence in the 20th Century Most of the basic principles of fluorescence were developed during the 1920's and 1930's. Excited state lifetime (Gaviola) Quantum yield (Wavilov) Polarization of fluorescence (Weigert, F. Perrin) Jablonski diagram (A. Jablonski) during the 1950's: Fluorescence resonance energy transfer ( T. Förster)
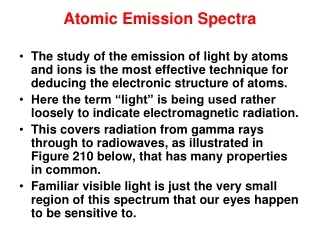
Virtually all fluorescence data required for any research project will fall into one of the following categories. 1. The fluorescence emission spectrum 2. The excitation spectrum of the fluorescence 3. The quantum yield 4. The polarization (anisotropy) of the emission 5. The fluorescence lifetime In this course, we examine each of these categories and briefly discuss historical developments, underlying concepts and practical considerations
The Jablonski Diagram The life history of an excited state electron in a luminescent probe Internal conversion ki ~ 1012 s-1 S2 Radiationlessdecayknd >1012 s-1 ki ~ 106 -1012 s-1 Inter-system crossing kx ~ 104 – 1012 s-1 S1 T1 kx ~ 10-1 – 105 s-1 Fluorescence kf ~ 107 – 109 s-1 Absorption Phosphorescence kph < 106 s-1 S0 • Key points: • Most emission/quenching/FRET/chemical reactions occur from the lowest vibrational level of S1 • Emission has lower energy compared to absorption (Stokes shift) • Excitation spectra are mirror images of the emission spectra • Triplet emission is lower in energy compared to singlet emission • Emission spectra are practically independent of the excitation wavelength
Specifically, although the fluorophore may be excited into different singlet state energy levels (e.g., S1, S2, etc) rapid thermalization invariably occurs and emission takes place from the lowest vibrational level of the first excited electronic state (S1). This fact accounts for the independence of the emission spectrum from the excitation wavelength. S2 S1 Absorption Fluorescence kf ~ 107 – 109 s-1 The fact that ground state fluorophores, at room temperature, are predominantly in the lowest vibrational level of the ground electronic state (as required from Boltzmann’s distribution law) accounts for the Stokes shift. S0 Finally, the fact that the spacings of the energy levels in the vibrational manifolds of the ground state and first excited electronic states are usually similar accounts for the fact that the emission and absorption spectra (plotted in energy units such as wavenumbers) are approximately mirror images
The fluorescence excitation spectrum The relative efficiencies of different wavelengths of incident light to excite fluorophores is determined as the excitation spectrum. In this case, the excitation monochromator is varied while the emission wavelength is kept constant if a monochromator is utilized - or the emitted light can be observed through a filter. detector Iem(lex) emission monochromator fixed light source Xenon or arc lamp excitation monochromator moving If the system is “well-behaved”, i.e., if the fluorescence intensity is proportional to the absorbed energy, excitation spectrum will match the absorption spectrum. However fluorescence detection is more sensitive (if detected at the wavelength of the maximum of the emission spectrum).
The fluorescence excitation spectrum Energy anthracene S1 Probability LOW HIGH MEDIUM v1 3 v 12 v 11 v1 0 S0 v 3 v 2 v 1 Inter-nuclear distance v 0
The fluorescence emission spectrum The relative distribution of various wavelengths in the light emitted after excitation by a single wavelength. In this case, the emission monochromator is varied while the excitation wavelength is kept constant if a monochromator is utilized - or the sample can be excited by monochromatic light source (laser). Iem(lem) detector The shape of the emission spectrum is within a certain range of excitation wavelength practically independent of the excitation wavelength, usually the wavelength of the maximum of the excitation spectrum is chosen for the emission spectrum measurement. emission monochromator moving light source excitation monochromator fixed
The fluorescence emission spectrum Energy anthracene S1 V1 3 V1 2 V1 1 v1 0 S0 Probability LOW HIGH MEDIUM v 3 v 2 v 1 Inter-nuclear distance v 0
The fluorescence spectra anthracene emission excitation Because of similarity in spacing of the energy levels in the vibrational manifolds of the ground state and first excited electronic states, the emission and absorption spectra (plotted in energy units such as wavenumbers) are approximately mirror images
The fluorescence spectra quinin sulphate emission excitation Mirror simmetry can be peturbed by an aditional band in the excitation spectrum caused by the excitation to S2 state.
The fluorescence spectra emission excitation fluorescein The mirror simmetry does not hold exactly when the spectra are plotted in wavelength units. http://www.fluorophores.tugraz.at/
The fluorescence spectra – possible artifacts The turbidity of the sample is too high and the excitation light does not penetrate deep enough and emission light is reabsorbed or scattered. • use diluted samples and filtered to eliminate scattering or measure close to the surface Raman scattering from the solvent. • subtract Raman spectrum of the solvent from the fluorescence spectrum • water has a strong O-H stretching band at Dn 3300 cm-1 Optical saturation appears at very high excitation intensities. Most molecules are at an excited state and cannot be excited any more. Emission intensity is, therefore, no more proportional to the excitation intensity. • measure at the range of proportionality between excitation and emission intensities
Fluorescence spectra and peptide/protein binding to membranes E1 Energy levels of molecules (and thus their spectra) are influenced by the properties of their environment, especially its polarity. Less polar environment blue shift The emission maximum of Trp in peptide melittin (bee venom) shifts from ~355 nm (water) to ~325 nm in hydrophobic environment lex = 280 nm The fraction of membrane-associated melittin and/or its depth of penetration to the membrane can be deduced from the spectral shift a – water b – DMPC/DHPC bicelles c – DMPC/DHPC/Chol bicelles Anderson et al. BBA 2007, 1768: 115
Fluorescence as a pH indicator E2 Fluorescence spectra of some molecules are sensitive to pH thanks to an equilibrium between protonated and deprotonated form of the fluorophore which differ in spectral properties Fluorescence spectroscopy can measure pH inside of cells and cellular compartments. Modern pH sensitive dyes can be genetically encoded highly specific location Excitation spectra of genetically encoded ratiometric pHluorin, lem = 508 nm, from Schulte et al. Plant Methods 2006, 2: 7
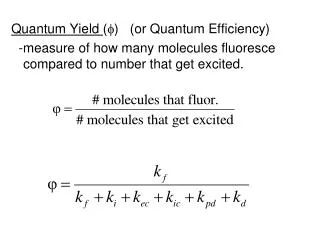
Quantum Yield Quantum yield can be defined: QY = Number of emitted photons / Number of absorbed photons The quantum yield of fluorescence (QY) is dependent on therate of the emission processdivided by the sum of therates of all other deactivation processes kfis the rate of fluorescence and knr is the sum of the rates of all radiationless deexcitation pathways. If the rates of the ratiationless deactivation processes are slow compared to krthen the QY is high However, if the rates of these other processes are fast compared to krthen QY is low
Acknowledgement The course was inspired by courses of: Prof. David M. Jameson, Ph.D. Prof. RNDr. Jaromír Plášek, Csc. Prof. William Reusch Financial support from the grant: FRVŠ 33/119970