1 / 41

N uclear M agnetic R esonance Spectroscopy

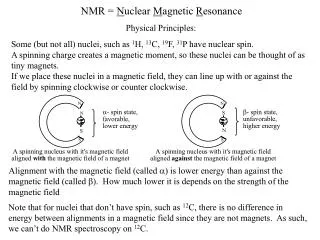
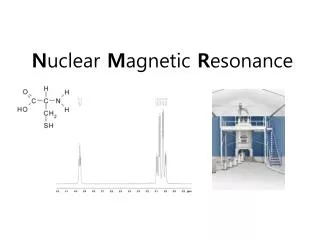
N uclear M agnetic R esonance Spectroscopy. The nuclei of interest are primarily hydrogen and carbon 1 H NMR also called PMR 13 C NMR also called CMR. Spinning proton resembles a tiny magnet. Protons in a magnetic field. Field Strength determines energy difference between spin states.

asher
Download Presentation

N uclear M agnetic R esonance Spectroscopy

An Image/Link below is provided (as is) to download presentation Download Policy: Content on the Website is provided to you AS IS for your information and personal use and may not be sold / licensed / shared on other websites without getting consent from its author. Content is provided to you AS IS for your information and personal use only. Download presentation by click this link. While downloading, if for some reason you are not able to download a presentation, the publisher may have deleted the file from their server. During download, if you can't get a presentation, the file might be deleted by the publisher.

E N D

Presentation Transcript


  1. Nuclear Magnetic Resonance Spectroscopy The nuclei of interest are primarily hydrogen and carbon 1H NMR also called PMR 13C NMR also called CMR

  2. Spinning proton resembles a tiny magnet

  3. Protons in a magnetic field

  4. Field Strength determines energy difference between spin states

  5. Induced field of C-H bond opposes b0

  6. Chemical shift- position determined by shielding

  7. Field sweep NMR instrument

  8. FT NMR Spectrometer

  9. NMR Information 1H NMR spectrum contains 3 pieces of information: 1. 2. 3.

  10. Chemical Shift

  11. Integration of PeaksThe red curves represent the peak areas ( integration)

  12. Peak SplittingThe (n+1) rule indicates the number of protons attached to neighboring carbon atoms A singlet indicates there are no protons on adjacent carbon atom A triplet indicates there are 2 protons on adjacent carbon atom

  13. Two Isomeric Esters C4H8O2 The signals for both spectra are the same: a singlet, triplet & quartet.

  14. Electron Withdrawing Effect triplet and quartet = ethyl pattern

  15. Chemical Shift6 regions of NMR spectrum

  16. Table of Chemical Shifts

  17. (n + 1) Rule for Signal Splitting

  18. Splitting Pattern of 1,1,2-trichloroethane

  19. Signal Splitting (1,1,2-trichloroethane)

  20. Signal Splitting from one adjacent proton

  21. NMR spectrum of p-xylene (no signal splitting)

  22. Interpreting Spectra • Look for diagnostic chemical shifts • Look for relative ratios (integration) • Analyze splitting patterns • Consult Tables of chemical shifts and Tables of coupling constants (J values)

  23. Splitting Pattern for Ethyl Group

  24. Pascal’s Triangle

  25. methyl propionate C4H8O2

  26. isopropanol C3H8O

  27. ethyl isopropyl ketone C6H12O

  28. allyl alcohol C3H6O

  29. ethyl vinyl ether C4H8O

  30. C8H8O2

  31. C9H10O3

  32. C4H7O2Br

  33. C6H12O2

  34. C6H4BrI

  35. C7H8O2

  36. C14H14

  37. C10H10O2

  38. C8H10O

  39. C3H4O

  40. C6H10

  41. C4H6O

More Related