Download
1 / 14
140 likes | 316 Views
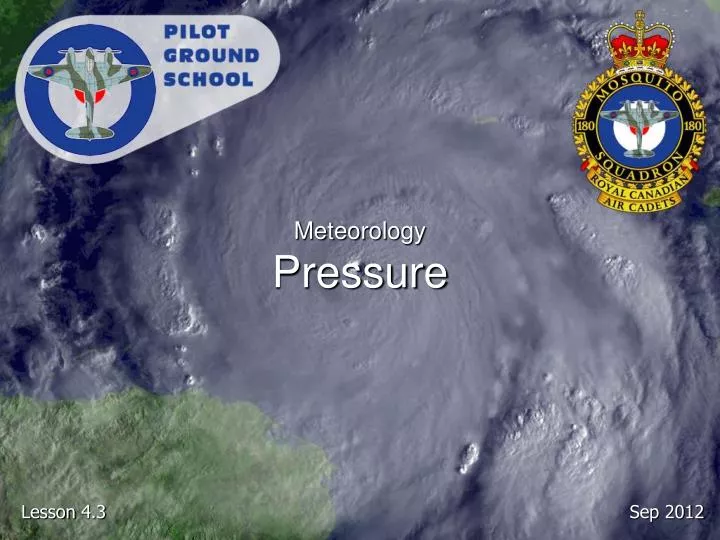
Meteorology Pressure. Reference. From the Ground Up Chapter 6.3: Pressure Pages 127 - 130. Introduction. Air pressure differences around the Earth cause many different pressure systems which in turn cause different weather phenomena.

E N D
Reference From the Ground Up Chapter 6.3: Pressure Pages 127 - 130
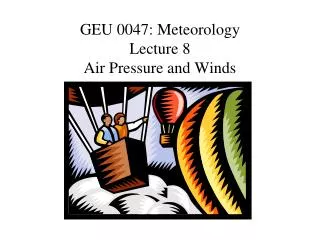
Introduction • Air pressure differences around the Earth cause many different pressure systems which in turn cause different weather phenomena. • Pilots need to recognize these pressure systems in order to know what weather will result.
Outline • Atmospheric Pressure • Pressure Systems • Pressure Gradient • Coriolis Force
Atmospheric Pressure • Pressure measured with a Mercury Barometer, expressed in inches of mercury (“ Hg) • Standard pressure= 29.92” Hg= 1 bar = 1013.2 mb (millibars)= 1013.2 hPa (hectopascals)= 101.3 kPa (kilopascals) • Station Pressure (actual pressure at observing station) is corrected to Mean Sea Level (MSL) Pressure to become Altimeter Setting
L H Actual Path Intended Path Altimeter Pressure Error • Low to high pressure, altimeter reads lower • “Low to high, watch the sky”
L H Intended Path Actual Path Altimeter Pressure Error • High to low pressure, altimeter reads higher • “High to low, look out below”
Pressure Systems • Weather maps show areas of pressure with different symbols/lines • Lines that join places of equal pressure are Isobars • Isobars in hectopascals, in intervals of 4, above and below 1000 hPa
Low Pressure Areas • Low Pressure Areas • Called cyclone, depression or low • Pressure lowest in centre • Wind flows counterclockwise, inwards towards centre, then up • Inward airflow called Convergence • Creates unstable, poor weather • Secondary Low • Smaller low within a low • Trough (of Low Pressure) • Elongated U-shaped are of low pressure
Low Pressure Areas • Example of hurricane (low pressure system)
High Pressure Areas • High Pressure Area • Called anticyclone or high • Pressure highest in centre • Wind flows down through centre, clockwise, then outwards • Outward airflow called Divergence • Creates stable, good weather • Ridge (of High Pressure) • Elongated U-shaped are of high pressure • Col • Neutral area between two highs and two lows
Pressure Gradient • Air moves from high pressure to low pressure (creating wind) • Pressure gradient is rate of change of pressure over distance at right angles to isobars • Closer isobars = steeper pressure gradient = faster winds
Coriolis Force • Created by Earth’s rotation, causes air to move parallel to isobars • In Northern Hemisphere, air spirals clockwise into low and counterclockwise out of high • Buys Ballot’s Law • If you stand with your back to the wind, low pressure area is on your left • On ground, Surface Friction slows down air and reduces coriolis force
Next Lesson 4.4 – Meteorology Winds From the Ground Up Chapter 6.4: Winds Pages 130 - 136