Download
1 / 71
820 likes | 1.25k Views
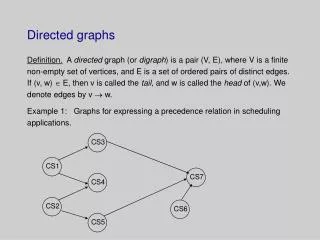
Causal Directed Acyclic Graphs (DAG) (Causal Diagrams) 2013 Eyal Shahar, MD, MPH Professor. What is a causal diagram?. Components Variables Unidirectional arrows. D. A. C. E. B. Rules: displaying variables. Called “nodes” or “vertices” Should be clearly understood by others

E N D
Causal Directed Acyclic Graphs (DAG)(Causal Diagrams)2013Eyal Shahar, MD, MPHProfessor
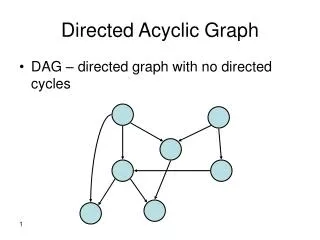
What is a causal diagram? • Components • Variables • Unidirectional arrows D A C E B
Rules: displaying variables • Called “nodes” or “vertices” • Should be clearly understood by others • Variables, not values of variables • “Smoking status” is okay; “smoking” is not • Displayed along the time axis (left to right) • but sometimes we ignore this rule
Rules: drawing arrows A B • An arrow • From a postulated cause to its postulated effect • No bidirectional arrows • An arrow with a question mark • The research question at hand • An arrow without a question mark • Background theory or axiomatic A B C ? A B
Rules: drawing arrows • Directed Acyclic Graph • Circularity does not exist • A future effect cannot be a cause of its cause in the past • So-called “circularity” • Directed acyclic graph with time-indexed variables A B C At=1 Bt=2 At=3 Bt=4
Example: a causal diagram for gastroesophageal reflux and esophageal disease S1 S2 ? T R1 R2 D1 D2 R=reflux S=symptoms T=treatment I=imaging D=esophagus status Ddx=diagnosed esophagus status I1 I2 D1dx D2dx
How does a causal diagram help in research? • Decodes causal assertions • All of science is about causation! • Clarifies our wordy or vague causal thoughts about the research topic • Connects “association” with “causation” • Helps us decide which covariates should enter the statistical model—and which should not • Unifies our understanding of confounding bias, colliding bias, information bias (and three other, less well, known biases) • Can depict and explain all types of bias
PubMed search (through 2012) • “Causal diagrams”: 83 titles • “Directed acyclic graph”: 137 titles (some irrelevant) • Still not widely known • Rarely used
Some references • Pearl J. Causality: models, reasoning, and inference. 2000. Cambridge University Press (2009, second edition) • Greenland S et al. Causal diagrams for epidemiologic research. Epidemiology 1999;10:37-48 • Robins JM. Data, design, and background knowledge in etiologic inference. Epidemiology 2001;11:313-320 • Hernan MA et al. A structural approach to selection bias. Epidemiology 2004;15:615-625 • Shahar E, Shahar DJ. Causal diagrams, information bias, and thought bias. Pragmatic and Observational Research 2010:1;33-47 • Shahar E, Shahar DJ: Causal diagrams and three pairs of biases. In: Epidemiology –Current Perspectives on Research and Practice (Lunet N, Editor). www.intechopen.com/books/epidemiology-current-perspectives-on-research-and-practice, 2012:pp. 31-62 (reading material for this module)
A natural path between two variables • Formally: a sequence of arrows, regardless of their direction, that connects two variables (and does not pass more than once through each variable) • Informally: “can walk from A to Z, or from Z to A, on bridges” A Z A B C D Z A B C D Z A B C D E Z
Types of natural paths between two variables • Causal paths • Confounding paths • Colliding paths
A causal path between two variables (also called “directed path”) • A natural path between A and Z, in which all the arrows point in the same direction (hence, “directed path”) • “A is a cause of Z” or “Z is a cause of A A Z A Z A B C Z C D A B Z A B Z
“Direct” versus “indirect” causal path • “Direct” is often (maybe always) over-simplification • Is it really direct? • No intermediary exists? • Better terminology: “causal paths in which no intermediary variables are known or displayed” • Overall (total) effect: by all directed paths (combined) Indirect causal path A B Z “direct” causal path
A confounding path between two variables • A natural path between A and Z that contains a shared cause of A and Z on this path (a confounder) C C X A A Z Z Alternative display A C A C X Z Z
A colliding path between two variables • A natural path between A and Z that contains at least two arrowheads that “collide” at some variable along this path (a collider on the path) L A Z M K A Z C Alternative display A C A K M Z L Z
Side point: collider (and confounder) are path-specific terms • A variable called a collider (or a confounder) on one path need not be a collider (or a confounder) on another path B D C A Z • C is a collider on one path (ABCDZ) and a confounder on another path (ACZ) 16
Identify and name each natural path between A and Z Q S R P A Z K M L
A bridge to “association” • What is “association”? • Mathematical phenomenon • Ability to guess the value of one variable based on the value of another variable • Are there “spurious associations”? • Mathematical relation between variables is never “spurious” • Poor word choice • “The association of A with Z is spurious.” What does the writer have in mind, though? • What creates associations? • A causal structure
A bridge between natural paths and associations • Which natural paths between A and Z contribute to the marginal (crude) association between A and Z? • Causal paths • Confounding paths • Which natural paths between A and Z do not contribute to an association between A and Z? • Colliding paths Open paths Blocked paths
Identify open paths and blocked paths (between A and Z) in this diagram B A C Z Open paths Blocked paths B D B A C Z A Z A C Z A Z B A Z D A C Z
When does an association between A and Z reflect the effect of A on Z? • When only causal paths contribute to the association between A and Z • When confounding paths do not exist, or are somehow blocked • Almost true: not a sufficient condition
How do we block a confounding path? • By conditioning on some variable along the path • What is “conditioning” on a variable? • Restricting the variable to one of its values • Various forms of “adjustment” • Standardization • Stratification and a weighted average (Mantel-Haenszel) • Adding an independent variable to a regression model
Conditioning on a variable… • Dissociates a variable from its causes and its effects A X V B Y C Z • Turns an open natural path into a blocked path A V Z A V Z
Deconfounding = blocking a confounding path C C X ? A Z A ? Z C But what if? X A ? Z
Induced paths • Conditioning on a collider creates (or contributes to) the association between the colliding variables L A Z M K A Z C • Why? • Later…
Induced paths • An induced path may contain • Only dashed lines • Dashed lines and arrows • Colliders • An induced path may be blocked or open • An induced path is blocked • If there is at least one collider on the path • An induced path is open • If there are no colliders on the path
Blocked induced paths Blocked induced path Blocked natural path A C E Z A C E Z B D B D Blocked induced path Blocked natural path A C E Z A C E Z B D B D
Open induced paths Blocked natural path Open induced path C C A B A B Z Z Blocked natural path Open induced path A C E Z A C E Z B D B D
Confounding bias and colliding bias • A confounding path contributes to the (marginal) association between A and Z • This unwanted contribution is called confounding bias • An open induced path contributes to the (conditional) association between A and Z • This unwanted contribution is called colliding bias
Can we block an open induced path? --Yes Open induced paths We can eliminate these paths by conditioning on C C C A B A B Z Z C A A C E E Z Z B D B D
Key questions • Why does a collider block a path? • Why don’t we observe an association between colliding variables? • Why does conditioning on a collider create an association between the colliding variables? Blocked path Open induced path A Z A Z C C
Intuitive explanation • A sample of N patients • Variables • M: meningitis status (yes, no) • S: stroke status (yes, no) • V: vital status (alive, dead) • Assume: causal reality is fully described in the diagram M S V
Is there a marginal (crude) association between meningitis status and stroke status? • No, we cannot guess stroke status from meningitis status (or vice versa) • Intuition: a common effect (vital status) cannot induce an association between its (past) causes • There is no transfer of guesses across a collider • A colliding path is a blocked path
Suppose we condition on V (vital status)… Stratum 1 (V=alive) Stratum 2 (V=dead) Alive patients Dead patients My guess: “No” My guess: “Yes” • We can make some guesses after conditioning • M (meningitis status) and S (stroke status) are associated within the strata of V (the collider)
Before and after conditioning… Blocked path Open induced path M S M S V V
Theorem and implications • Theorem • Colliding variables will be associated within at least one stratum of their collider • Implications • a Mantel-Haenszel summary measure of association will differ from the crude, if we summarize across a collider • A regression coefficient will change if we “adjust” for a collider
Goal: estimate a measure of effect (causation) by a measure of association • Association is estimating causation (AZ) when: • The association between A and Z is due only to AZ • direct and indirect paths combined • Methods • Display variables and causal assumptions in a causal diagram • Block all confounding paths between A and Z • Do not create open induced paths between A and Z • or eliminate them, if created
Confounding bias (again) • The most widely known • Historical definitions and identification methods • “Lack of exchangeability” • “Mixed effects” • “Non-collapsibility” • “Change-in-estimate” • A fair amount of confusion The basic causal structure C ? A Z
So what is a confounder? • A confounder is a common cause of the exposure (A) and the disease (Z) A B C D Z Confounder Note: we can block the path by conditioning on B or C or D. C B D A Z
Endless complexity Exposure: E0(baseline exposure) Disease: D2 (follow-up) Question: Which is the confounder? Q−3 Q−2 Q−1 Q0 E−3 E−2 E1 E−1 E0 D−2 D1 D2 D0 D−1
Colliding bias • Formerly known as “selection bias” • Confusing names and types • “No representativeness” • “Biased sample” • “Convenient sampling” • “Control-selection bias” • “Survival bias” • “Informative censoring” The basic causal structure ? Z A C
But there are many more versions X X Y C C ? ? A Z A Z X C ? C Z A A Z
Confounder versus collider Confounder A Z Collider
confounding bias and colliding bias: an antithetical pair Confounder Collider ? C Z A ? A Z C Bias No bias ? Z A C ? A Z C Bias No bias
What is selection bias? • A type of colliding bias • Should be called “sampling colliding bias”
Types of colliding bias • Sampling colliding bias • Every study is restricted to selected people • Inevitable conditioning on “selection status” (S) • Sometimes, this unavoidable conditioning creates colliding bias • Analytical colliding bias • Restricted analysis: computing association for one stratum of a collider • Stratified analysis: computing association for each stratum of a collider • Adjustment by analysis • Computing a weighted average across the collider • Adding the collider to a regression model, as a covariate
Sampling colliding bias: a wrong sampling decision • What happens if we estimate the effect of marital status (A) on dementia status (Z) in a sample of nursing home residents? • Restricting recruitment to nursing home residents • Assumptions • No effect of A on Z • Both variables affect “place of residence” (P) (nursing home or elsewhere)
Causal diagrams (marital status) A (dementia status) Z (marital status) A (dementia status) Z P P P P S S (Selectionstatus)
Sampling colliding bias: a wrong sampling decision • What happens if we estimate the effect of coughing status (A) on abdominal pain status (Z) in a sample of hospitalized patients? • Restricting recruitment to hospitalized patients • Assumptions • Displayed in the diagram (next slide) • H is hospitalization status