Download
1 / 44
450 likes | 458 Views
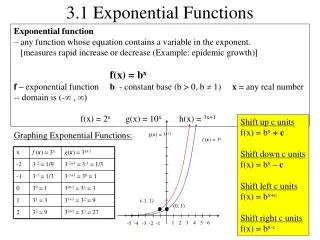
Review Homework (3.1 Graphing exponential functions). You graphed and analyzed exponential functions. (Lesson 3-1). Evaluate expressions involving logarithms. Sketch and analyze graphs of logarithmic functions. Then/Now. logarithmic function with base b logarithm common logarithm

E N D
You graphed and analyzed exponential functions. (Lesson 3-1) • Evaluate expressions involving logarithms. • Sketch and analyze graphs of logarithmic functions. Then/Now
logarithmic function with base b • logarithm • common logarithm • natural logarithm Vocabulary
Evaluate Logarithms A. Evaluate log216. log216 = y Let log216 = y. 2y= 16 Write in exponential form. 2y= 24 16 = 24 y = 4 Equality property of exponents. Answer:4 Example 1
B.Evaluate . = y Let = y. 5y= Write in exponential form. 5y= 5–3 = 5–3 Evaluate Logarithms y = –3 Equality property of exponents. Answer:–3 Example 1
C.Evaluate . = y Let log3 = y. 3y = Write in exponential form. 3y = 3–3 = 3–3 Evaluate Logarithms y = –3 Equality property of exponents. Answer:–3 Example 1
Evaluate Logarithms D.Evaluate log17 17. log1717 = y Let log1717 = y. 17y= 17 Write in exponential form. 17y= 17117= 171 y = 17 Equality property of exponents. Answer:1 Example 1
Evaluate . A. –4 B. 4 C. –2 D. 2 Example 1
Apply Properties of Logarithms A. Evaluate log8 512. log8512 = log88383 = 512 =3 logbbx = x Answer:3 Example 2
Apply Properties of Logarithms B. Evaluate 22log22 15.2. 22log22 15.2=15.2 blogbx = x Answer:15.2 Example 2
Evaluate 7log7 4. A. 4 B. 7 C. 47 D. 74 Example 2
Common Logarithms A. Evaluate log 10,000. log10,000 = log10410,000 = 104 = 4 log10x = x Answer:4 Example 3
Common Logarithms B. Evaluate 10log 12. 10log 12 = 12 10log x = x Answer:12 Example 3
Common Logarithms C. Evaluate log 14. log 14 ≈ 1.15 Use a calculator. Answer:1.15 CHECKSince 14 is between 10 and 100, log 14 is between log 10 and log 100. Since log 10 = 1 and log 100 = 2, log 14 has a value between 1 and 2. Example 3
Common Logarithms D. Evaluate log (–11). Since f(x) = logbx is only defined when x > 0, log (–11) is undefined on the set of real numbers. Answer:no real solution Example 3
Evaluate log 0.092. A. about 1.04 B. about –1.04 C. no real solution D. about –2.39 Example 3
Natural Logarithms A. Evaluate ln e4.6. ln e4.6 = 4.6 ln ex= x Answer:4.6 Example 4
Natural Logarithms B.Evaluate ln (–1.2). ln (–1.2) undefined Answer:no real solution Example 4
Natural Logarithms C.Evaluate eln 4. eln 4=4 elnx = x Answer:4 Example 4
Natural Logarithms D.Evaluate ln 7. ln 7 ≈ 1.95 Use a calculator. Answer:about 1.95 Example 4
Evaluate ln e5.2. A. no real solution B. about 181.27 C. about 1.65 D. 5.2 Example 4
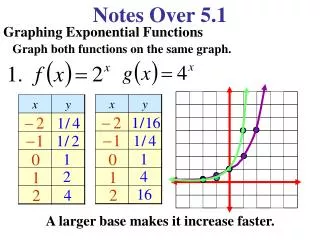
Graphs of Logarithmic Functions A. Sketch and analyze the graph of f(x) = log2 x. Describe its domain, range, intercepts, asymptotes, end behavior, and where the function is increasing or decreasing. Construct a table of values and graph the inverse of this logarithmic function, the exponential function f–1(x) = 2x. Example 5
Graphs of Logarithmic Functions Since f(x) = log2x and f–1(x) = 2x are inverses, you can obtain the graph of f(x) by plotting the points (f–1(x), x). Example 5
Answer:Domain: (0, ∞); Range: (–∞, ∞); x-intercept: 1; Asymptote: y-axis; Increasing: (0, ∞); End behavior: ; Graphs of Logarithmic Functions Example 5
B. Sketch and analyze the graph of Describe its domain, range, intercepts, asymptotes, end behavior, and where the function is increasing or decreasing. Construct a table of values and graph the inverse of this logarithmic function, the exponential function . Graphs of Logarithmic Functions Example 5
Since are inverses, you can obtain the graph of g(x) by plotting the points (g–1(x), x). Graphs of Logarithmic Functions Example 5
Answer:Domain: (0, ∞); Range:(–∞, ∞); x-intercept: 1; Asymptote: y-axis; Decreasing: (0, ∞); End behavior: ; Graphs of Logarithmic Functions Example 5
A. B. C. D. Describe the end behavior of f(x) = log4x. Example 5
Graph Transformations of Logarithmic Functions A. Use the graph of f(x) = log x to describe the transformation that results in p(x) = log (x + 1). Then sketch the graph of the function. The function is of the form p(x) = f(x + 1). Therefore, the graph p(x) is the graph of f(x) translated 1 unit to the left. Answer:p(x) is the graph of f(x) translated 1 unit to the left. Example 6
x – 2 Graph Transformations of Logarithmic Functions B. Use the graph of f(x) = log x to describe the transformation that results in m(x) = –log x – 2. Then sketch the graph of the function. The function is of the form m(x) = –f(x) – 2. Therefore, the graph of m(x) is the graph of f(x) reflected in the x-axis and then translated 2 units down. Answer:m(x) is the graph of f(x) reflected in the x-axis and then translated 2 units down. Example 6
Graph Transformations of Logarithmic Functions C. Use the graph of f(x) = log x to describe the transformation that results in n(x) = 5 log (x – 3). Then sketch the graph of the function. The function is of the form n(x) = 5f(x – 3). Therefore, the graph of n(x) is the graph of f(x) expanded vertically by a factor of 5 and then translated 3 units to the right. Answer:n(x) is the graph of f(x) expanded vertically by a factor of 5 and then translated 3 units to the right. Example 6
A. The graph of p(x) is the graph of f(x) translated 2 units to the left and 1 unit down. B. The graph of p(x) is the graph of f(x) translated 2 units to the right and 1 unit down. C. The graph of p(x) is the graph of f(x) translated 2 units to the left and 1 unit up. D. The graph of p(x) is the graph of f(x) translated 2 units to the right and 1 unit up. A. Use the graph of f(x) = ln x to describe the transformation that results in p(x) = ln (x – 2) + 1. Then sketch the graphs of the functions. Example 6
A. EARTHQUAKES The Richter scale measures the intensity R of an earthquake. The Richter scale uses the formula R , where a is the amplitude (in microns) of the vertical ground motion, T is the period of the seismic wave in seconds, and B is a factor that accounts for the weakening of seismic waves. Find the intensity of an earthquake with an amplitude of 250 microns, a period of 2.1 seconds, and B = 5.4. Use Logarithmic Functions Example 7
R = Original Equation = a = 250, T = 2.1, and B = 5.4 Use Logarithmic Functions ≈ 7.5 The intensity of the earthquake is about 7.5. Answer: about 7.5 Example 7
B. EARTHQUAKES The Richter scale measures the intensity R of an earthquake. The Richter scale uses the formula R , where a is theamplitude (in microns) of the vertical ground motion, T is the period of the seismic wave in seconds, and B is a factor that accounts for the weakening of seismic waves. A city is not concerned about earthquakes with an intensity of less than 3.5. An earthquake occurs with an amplitude of 125 microns, a period of 0.33 seconds, and B = 1.2. What is the intensity of the earthquake? Should this earthquake be a concern for the city? Use Logarithmic Functions Example 7
R = Original Equation = a = 125, T = 0.33, and B = 1.2 Use Logarithmic Functions ≈ 3.78 The intensity of the earthquake is about 3.78. Since 3.78 ≥ 3.5, the city should be concerned. Answer: about 3.78 Example 7
C. EARTHQUAKES The Richter scale measures the intensity R of an earthquake. The Richter scale uses the formulaR , where a is the amplitude (in microns) of the vertical ground motion, T is the period of the seismic wave in seconds, and B is a factor that accounts for the weakening of seismic waves. Earthquakes with an intensity of 6.1 or greater can cause considerable damage to those living within 100 km of the earthquake’s center. Determine the amplitude of an earthquake whose intensity is 6.1 with a period of 3.5 seconds and B = 3.7. Use Logarithmic Functions Example 7
Use a graphing calculator to graph and R = 6.1 on the same screen and find the point of intersection. Use Logarithmic Functions Example 7
Use Logarithmic Functions An earthquake with an intensity of 6.1, a period of 3.5, and a B-value of 3.5 has an amplitude of about 879 microns. Answer: about 879 microns Example 7