Download
1 / 27
270 likes | 402 Views
Lessons Learned: One-Atmosphere Photochemical Modeling in Southeastern U.S. Presentation from Southern Appalachian Mountains Initiative to Meeting of Regional Planning Organizations December 3, 2002. SAMI Atmospheric Modeling. Unique Contributions:

E N D
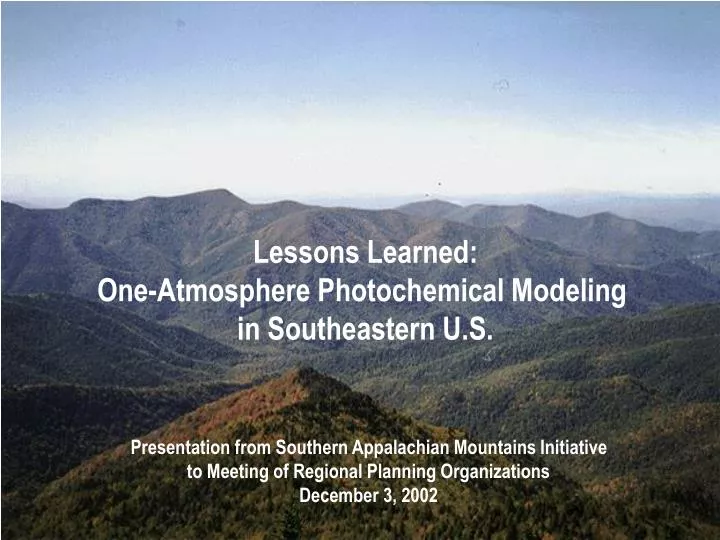
Lessons Learned: One-Atmosphere Photochemical Modeling in Southeastern U.S. Presentation from Southern Appalachian Mountains Initiative to Meeting of Regional Planning Organizations December 3, 2002
SAMI Atmospheric Modeling • Unique Contributions: • Demonstrated fully-integrated one-atmosphere model • ozone, aerosols, and deposition • “performance comparable to or better than recent applications of CMAQ or REMSAD”
SAMI Atmospheric Model • In 1997 selected to use: • RAMS-3B meteorological model • EMS-95 emissions model • Urban to Regional Multi-scale (URM) air quality model • variable grid (12-km over Southern Appalachian Mountains) • SAPRC chemical mechanism for gases • ISORROPIA for aerosols • Reactive Scavenging Module for deposition • Decoupled Direct Method for sensitivity to emissions changes
SAMI Atmospheric Modeling Domain Georgia Institute of Technology
SAMI Atmospheric Modeling • Unique Contributions: • Selected episodes to represent annual and seasonal air quality measures • based on meteorology characterized for 5-year period • 9 episodes in Feb, Mar, Apr, May, Jun, Jul, Aug • Lesson learned: prioritize computational power: greater spatial resolution or longer time periods?
SAMI Atmospheric Model: Lessons Learned • Emissions Inventory uncertainties: • especially NH3, primary OC; non-road, area sources • Meteorological Model performance: • clouds and precipitation affect chemistry and deposition • wind speed and direction, mixing heights affect transport
SAMI Atmospheric Model: Lessons Learned • Air Quality Observations limited spatially and temporally: • PM2.5 data, especially NH4 • wet and dry deposition data • vertical profiles for initial and boundary conditions
SAMI Atmospheric Model: Lessons Learned • Photochemical Model Performance: • SO4 and OC best performance (+/- 50%), largest components of PM2.5 • overpredict NO3, soil, and EC; small components • SO4 not fully neutralized by NH4, atmosphere NH4- limited • need better measures: NH3, NH4, primary vs secondary OC
URM Model Performance - Fine Particle MassGreat Smoky Mtns Class 1 Class 2 Class 3 Class 4 Class 5 30.0 (mg/m3) 20.0 10.0 Concentration 0 2/09/94 3/24/93 4/26/95 8/04/93 8/07/93 8/11/93 7/12/95 7/31/91 7/15/95 Modeled (left) IMPROVE (right) SO4 NO3 NH4 ORG EC SOIL 2/01/01
25.0 20.0 15.0 URM Modeled Concentration (mg/m3) 10.0 5.0 0.0 0.0 5.0 10.0 15.0 20.0 25.0 IMPROVE Measurements (mg/m3) URM Model Performance: Sulfate Fine Particle Mass + 50% July 1995 May 1995 May 1993 March 1993 February 1994 July 1991 - 50% June 1992 August 1993 April 1995 (based on data from 3-10 IMPROVE sites in 12, 24, and 48 km grids)
70.0 60.0 50.0 40.0 30.0 20.0 10.0 0.0 0.0 10.0 20.0 30.0 40.0 50.0 60.0 70.0 URM Model Performance: PM2.5 Mass + 50% July 1995 May 1995 May 1993 March 1993 URM Modeled Concentration (mg/m3) February 1994 July 1991 - 50% June 1992 August 1993 April 1995 IMPROVE Measurements (mg/m3) (based on data from 3-10 IMPROVE sites in 12, 24, and 48 km grids)
250 200 150 100 50 0 1992 1993 1993 June 24-29, 1995 August 3-11, March 23-30, Feb 8-15, 1994 April 26 - May 3, May 23-30, 1995 May 11-18, 1993 July 23-30, 1991 July 11-18, 1995 Wet Ammonium Deposition Normalized Percent Bias (based on data from 9-14 NADP wet deposition sites in 12, 24, and 48 km grids) Normalized Percent Bias
SAMI Atmospheric Modeling • Unique Contributions: • To assess effects, used modeled relative change in air quality to adjust measured air quality: • visibility • ozone effects to forests • acid deposition effects to streams and forests • Lesson learned: bound relative reduction factor by model performance
SAMI Atmospheric Modeling • Unique Contributions: • Used direct sensitivity analyses to evaluate state contributions to Class I areas • Decoupled Direct Method (DDM-3D) • evaluated responses to 10% change in emissions • Lessons learned: • trust relative contributions rather than absolute • daily source contributions from DDM compare favorably to daily back trajectories
DDM Sensitivity Performance SO2 NOx NH3 VOCs Ozone Good Good Gaseous Species SO2 Good NH3 Good SO4 Good Good NO3 Good Poor Good Fair Aerosol Species NH4 Good Good Fair Good OC Good Good EC SOIL Wet Deposition Species PM2.5 Good Good Poor Good SO4 Good NO3 Poor Good Poor Good NH4 Poor Poor Poor Poor
Annual SO4 Fine Particles Response to 10% Reduction in SO2 Emissions from 2010 A2 strategy -8.0 Non-SAMI states SAMI states -6.0 -4.0 SO4 Fine Particle Response (%) -2.0 0.0 Shining Rock, NC Dolly Sods, WV Otter Creek, WV Joyce Kilmer, NC Linville Gorge, NC Shenanhoah, VA Great Smoky Mtn, TN James River Face, VA Sipsey, AL Cohutta, GA
2/9/1994 5/3/1995 8/4/1993 8/7/1993 7/12/1995 7/15/1995 7/19/1999 5/24/1995 5/27/1995 5/12/1993 5/15/1993 3/24/1993 3/27/1993 3/31/1993 2/12/1994 4/26/1995 4/29/1995 6/24/1992 6/27/1992 8/11/1993 7/24/1991 7/27/1991 7/31/1991 Sulfate Aerosol Normalized Percent Bias 150 100 50 Normalized Percent Bias 0 -50 -100 (based on data from 3-10 IMPROVE sites in 12, 24, and 48 km grids)
Ammonium Aerosol Normalized Percent Bias 120 100 80 60 40 Normalized Mean Bias 20 0 -20 -40 -60 2/9/1994 5/3/1995 8/4/1993 8/7/1993 7/15/1995 7/19/1999 5/24/1995 5/27/1995 5/12/1993 5/15/1993 3/24/1993 3/27/1993 3/31/1993 2/12/1994 4/26/1995 4/29/1995 6/24/1992 6/27/1992 8/11/1993 7/24/1991 7/27/1991 7/31/1991 7/12/1995 (based on data from 3-10 IMPROVE sites in 12, 24, and 48 km grids)
Organic Aerosol Normalized Percent Bias 120 100 80 60 Normalized Percent Bias 40 20 0 -20 -40 -60 2/9/1994 5/3/1995 8/4/1993 8/7/1993 7/19/1999 5/24/1995 5/27/1995 5/12/1993 5/15/1993 3/24/1993 3/27/1993 3/31/1993 2/12/1994 4/26/1995 4/29/1995 6/24/1992 6/27/1992 8/11/1993 7/24/1991 7/27/1991 7/31/1991 7/12/1995 7/15/1995 (based on data from 3-10 IMPROVE sites in 12, 24, and 48 km grids)
Nitrate Aerosol Normalized Percent Bias 250 200 150 Normalized Percent Bias 100 50 0 -50 2/9/1994 5/3/1995 8/4/1993 8/7/1993 7/15/1995 7/19/1999 5/24/1995 5/27/1995 5/12/1993 5/15/1993 3/24/1993 3/27/1993 3/31/1993 2/12/1994 4/26/1995 4/29/1995 6/24/1992 6/27/1992 8/11/1993 7/24/1991 7/27/1991 7/31/1991 7/12/1995 (based on data from 3-10 IMPROVE sites in 12, 24, and 48 km grids)
PM 2.5 Normalized Percent Bias (based on data from 3-10 IMPROVE aerosol sites in 12, 24, and 48 km grids) 200 150 100 Normalized Bias (%) 50 0 -50 -100 2/9/94 8/7/93 4/29/95 7/24/91 7/15/95 8/11/93 8/4/93 7/27/91 3/24/93 5/24/95 7/12/95 7/19/95 3/31/93 4/26/95 5/15/93 5/27/95 6/24/92 6/27/92 7/31/91 5/21/95 2/12/94 3/27/93 5/12/93 Normalized Bias of +/- 50% is potential criteria for aerosol model performance
Aerosol Model Performance URM Model Results vs. Observations for July 15, 1995 40.0 30.0 20.0 PM 2.5 (m g/m3) 10.0 0.0 Modeled on Left, IMPROVE On Right James River Face, VA Shenandoah, VA Great Smoky Mtns.,TN Shining Rock, NC Sipsey, AL Dolly Sods, WV 2/01/01 SO4 NO3 NH4 ORG EC SOIL
Wet Sulfate Deposition Normalized Percent Bias (based on data from 9-14 NADP wet deposition sites in 12, 24, and 48 km grids) 10 5 0 Normalized Percent Bias -5 -10 -15 -20 -25 -30 1995 1994 Feb 8-15, May 3, April 26 - 11, 1993 August 3- 1995 1995 1993 30, 1993 July 23-30, May 23-30, May 11-18, 1991 1992 June 24-29, March 23- July 11-18,