Download
1 / 49
490 likes | 746 Views
8 YEARS OF FISHERIES IN CPP. Experiences and lessons learned in CPP and Reflections on Inland Fisheries in Bangladesh by Gertjan de Graaf Fisheries advisor CPP 1992-2000. MAIN OBJECTIVE OF THE FISHERIES PROGRAMME OF CPP. Estimate the impact of CPP interventions on fisheries

E N D
8 YEARS OF FISHERIES IN CPP Experiences and lessons learned in CPP and Reflections on Inland Fisheries in Bangladesh by Gertjan de Graaf Fisheries advisor CPP 1992-2000
MAIN OBJECTIVE OF THE FISHERIES PROGRAMME OF CPP • Estimate the impact of CPP interventions on fisheries • Minimize negative impacts through adapted designs, construction and water management • Mitigate eventual negative impacts
THE FISHERIES PROGRAMME OF CPP FOCUSSED ON TWO LINES • Studies on fisheries • Mitigation of negative impacts through aquaculture extension the second activity as it was a general belief that interventions of CPP would have a negative impact on fisheries
FISHERIES STUDIES OF CPP • Estimation of total catch before and after CPP • Migration of riverine hatchlings and design of fish friendly regulators • Reproductive strategies of Beel resident fish species and their impact on water management • Development of predictive tools for fisheries and water management
ESTIMATION OF THE TOTAL FISH CATCH IN THE CPP PROJECT AREA Traditional fisheries monitoring: • Follows the number of fishermen or estimates Fishing Effort • Estimate the catch of the fishermen or Catch per Unit of Effort (CPUE) • Total catch = Fishing Effort x CPUE
60-70% of the rural population is sometimes fishing Statistically it is difficult to estimate this Fishing Effort HOWEVER THIS TRADITIONAL METHOD IS DIFFICULT TO APPLY IN FLOODPLAIN FISHERIES
A NEW METHODHABITAT FISHERIES MONITORING • Monitoring of representative fishing Areas • How to select the areas ?
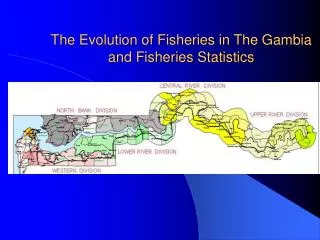
What is representative for a fishing area ? • Depth of Water ? • Duration of Flooding ? • Beels ? • Perennial Beels ? • Seasonal Beels ? Lets have a closer look at the floodplain
A Beel or Floodplain has no depth MAY SEPTEMBER WHICH DEPTH OR LOCATION DO WE SELECT ?
VERY CLEAR CRITERIA ARE NEEDED • criteria which can be quantified • can be replicated • are valid and can be used all over Bangladesh • are simple and practical
ONLY THE MPO LAND TYPE CLASSIFICATION FITS THE CRITERIA • The classification is preciselydefined F3 Water depth of 180 cm or more F2 180-90 cm F1 90-30 cm F0 30-0 cm • The Land types have a fixed position, related to the risks of flooding • They only change due to water management interventions when the risks are changed
CPP FISHERIES MONITORING SITES We selected fixed areas representative for F3 Land types F2 Land Types Khals Lohajang River
F3 Sites F2 Sites MONITORING SITES FOR LANDTYPES IN CPP IN EACH SITE WE CARRIED OUT A TRADITIONAL FISHERIES MONITORING PROGRAMME
Catch = Catch per Unit of Area x Total area THE TOTAL FLOODED AREA FOR EACH LAND TYPE WAS DETERMINED WITH GIS
DRY YEARS WET YEARS AVERAGE MONTHLY WATER LEVEL THE RESULTS OVERALL FISH CATCH OVER THE LAST 8 YEARS F3 FISH CATCH F2 FISH CATCH
MAJOR CONCLUSIONS FOR CPP • The fish catch in CPP is highly variable with an average 300 mt/year • No significant trends in fish catch before or after CPP • F2 lands are the most important fishing areas in terms of total catch
EVERYBODY EXPECTED A DECLINE IN FISH CATCHWHY IS THERE NO DIFFERENCE BEFORE AND AFTER CPP ? THERE IS NO SIGNIFICANT DIFFERENCE IN THE AVERAGE FLOODED AREA BEFORE OR AFTER CPP
THIS AS CPP APPLIES “CONTROLLED FLOODING” • Only peak water levels are controlled • Statistically no differences can be found on flooded areas during the monsoon
The fundamental difference between Agriculture and Fisheries • The farmers are working with “risks” Taking away the risk of a four days extreme water level will change agriculture crop types used • Fish production is determined by monthly flooded area, a number of days with extreme water levels does not have a significant impact
THE “ADDED VALUE” OF THE CPP EXPERIENCE FOR THE WHOLE OF BANGLADESH WHAT IS THE VALUE OF FISHERIES NOW WE HAVE A LONG TERM RELIABLE DATA SET F3 land 160 kg/ha/year or a Net benefit of 12000 Tk/ha/season • F2 Lands 85 kg/ha/year or a Net benefit of 5600 Tk/ha/season
POVERTY AND DISTRIBUTION OF AGRICULTURE & FISHERIES BENEFITS
FINAL CONCLUSIONS Controlled Flooding is a much better option for fisheries then Complete Flood Control In the time of“rice self sufficiency”in Bangladeshthe agriculture development policycould needsome “re-thinking”
MECHANISMS BEHIND FLOODPLAIN FISHERIES • CPP collected 8 years data on floodplain fisheries • This allows for a profound statistical analysis • Questions 1:What are the driving forces behind floodplain fisheries • Question 2: How do they impact management
THE PRINCIPAL COMPONENTS OF FISHERIES HABITAT FISHERMEN FISH THEY ARE LINKED TO EACH OTHER
THE THREE COMPONENTS IN CPP FISHERIES • FISH: Fish stocks or abundance of fish • HABITAT: water level or flooding • FISHERMEN: fishing effort Fish catch is highly variable
WHY IS THE CATCH SO VARIABLE ? Fish abundance or CPUE Fishing effort FISH CATCH Extent of flooding or Water level WHAT IS THE IMPACT OF EACH VARIABLE ON THE FISH CATCH
STATISTICAL ANALYSIS-ANOVA • 74% of the seasonal and inter annual variance in observed yields can be explained by changes in fishing effort • 15% can be explained in changes in CPUE • 11% can be explained by changes in Water level
Multi linear regressionwith Effort, CPUE and Water level FISH CATCH =A*FISH ABUNDANCE + B*FISHING EFFORT+C* FLOOD
CONCLUSIONS The major driving force in floodplain fisheries in CPP and most likely also in the rest of Bangladesh is the fishing effort or the number of fishermen
CONSEQUENCES FOR MANAGEMENT • management which does not include fishing effort is doomed to fail. • The impact of over-exploitation of fish stocks is under estimated in Bangladesh
AN OFTEN HEARD STORY • When I was young there was plenty of fish in the Beel • When I went fishing with my father we caught plenty of Boal in one day • Remember when you were young it was 1965, with 65 million people in Bangladesh • Now we are with 110 million, with half of them fishing
AN EXAMPLE OF THE CONSEQUENCES • Species composition was followed over the years in the CPP area • In one Beel, Garinda Beel we saw dramatic changes WHY ?
GARINDA BEEL COMPLETELY COLLAPSEDGOTOKBARI BEEL REMAINED OK GARINDA GOTOKBARI Species composition did not change Beel fish is replaced by prawns
WHY DID GARINDA BEEL COLLAPSE Fishing effort during the dry season increased rapidly in Garinda Dry season area in Garinda decreased rapidly
CONSEQUENCES FOR MANAGEMENT • The dry season area of the water bodies is as important as the total flooded area during the monsoon • No reproduction --> No fish in the monsoon • This is an important aspect for developments of surface water irrigation of the Borro in the dry season
LET’S LOOK AT THE CONSEQUENCES OF FISHING EFFORT ON THE WHOLE OF BANGLADESH Data from different projects • Chandpur Irrigation project • CPP project • FAP 17 • International data on tropical inland fisheries • Khulna Jessore Drainage Rehabilitation Project
MECHANISMS AND FUTURE PROSPECTS, A PESSIMISTIC VIEW • In over exploited floodplains slow growing, late maturing species are replaced by quick growing fast maturing species. A shift from Major carps to Beel resident species occurs • If recruitment of Beel residents is hampered or if fishing effort is too high in the dry season a further shift from Beel residents towards small prawns occurs • If floodplain is completely cut off the final shift towards prawns and Snakeheads or Catfish occurs
SUCCESSIVE STAGES OF BIO DIVERSITY AND WATER MANAGEMENT CARPS DISAPPEARS BEEL FISH DISAPPEARS PRAWNS & CATFISH REMAIN
Habitat restoration, fish sanctuaries, fish passes, excavation of khals, participatory management, etc, the main actions of fisheries management at present, certainly improves the situation for fisheries. However, avoiding the main issue, FISHING EFFORT, will lead to the situation that“Mache Bathe Bengali”becomes history and“Dal Bathe Bengali”becomes reality