Download
1 / 14
140 likes | 222 Views
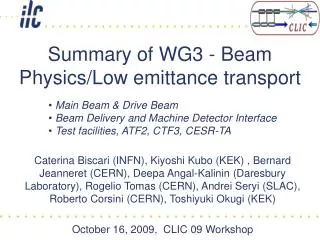
Ozone Transport Climatology in the Eastern US: Summary of OTAG AQA Workgroup Results. Bret Schichtel and Rudolf Husar Washington University St. Louis, MO Richard Poirot and Paul Wishinski Vermont Department of Environmental Conservation.

E N D
Ozone Transport Climatology in the Eastern US: Summary of OTAG AQA Workgroup Results Bret Schichtel and Rudolf HusarWashington University St. Louis, MO Richard Poirot and Paul WishinskiVermont Department of Environmental Conservation Presented at the 78th Annual American Meteorological Society MeetingPhoenix, AZ July 16 - 18, 1997
Synoptic Scale Transport Analyses • Blumenthal et al., 1997 • The analysis techniques characterize regional scale transport • Cannot identify local flows or near by source influences
Meteorological Data National Meteorological Centers Nested Grid Model (NGM) Time range:1989 - 6/97 Horizontal resolution: ~ 160 kmVertical resolution: 10 layers up to 7 km3-D variables:u, v, w, temp., humiditySurface variables include: Precip, Mixing Hgt,….
Regional Impact Analysis Transport Wind Vector Source Region of Influence
Residence Time AnalysisWhere is the airmass most likely to have previously resided Whiteface Mt. NY, June - August 1989 - 95 BackTrajectories Residence Time Probabilities Wishinski and Poirot, 1995
Incremental Probability How much greater than “normal” is probability a location was upwind if the Ozone was high? Every Day Probability High Day Probability Incremental Probability: High Day vs Every Day
Upper 50% Ozone Vs. Everyday Incremental Probability Plots • Regions implicated increase from south to north
Incremental Probability Plots Upper 50% Ozone Vs. Everyday • Each Site or Sub region is associated with unique source areas • At many receptors high ozone is associated with airflow from the central east
Lower 50% Ozone Upper 50% Ozone Incremental Probabilities 23 Combined Receptor Sites
Ozone roses for selected 100 mile size sub-regions. Calculated from measured surface winds and ozone data. At many sites, the avg. O3 is higher when the wind blows from the center of the domain.
OTAG Modeling Episodes Representativeness Transport winds during the ‘91,‘93,‘95 episodes are representative of regional episodes. Comparison of transport winds during the ‘91, ‘93, ‘95 episodes with winds during regional episodes in general. Comparison of transport winds during the ‘91, ‘93, ‘95 episodes with winds during locally high O3.
Conclusions • High ozone in the southern portion of the OTAG domain are associated with stagnant regional transport conditions. • High ozone levels in the northern portion of the OTAG domain are more typically associated with higher speed and persistent regional transport conditions from inside OTAG. • Low ozone is associated with swift regional transport from outside the US. • Regional transport in any direction from the central portion of the OTAG domain is associated with high ozone levels in the neighboring areas. • The transport condition during the ‘91, ‘93, and ‘95 OTAG episodes are representative of regional episodes.