Download

1 / 24
250 likes | 453 Views
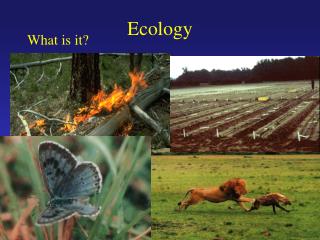
ECOLOGY. Study of an Ecosystem. Preparation Fieldwork Follow-up activities Report writing. Preparation. Learning objectives Advance planning Safety. Quantitative Study. Syllabus 1.5.3. Quantitative Study of plants and animals of a sample area of the selected ecosystem.

E N D
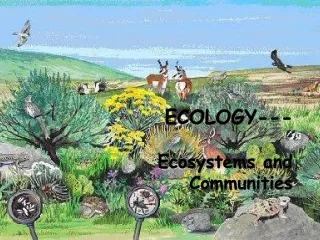
Study of an Ecosystem • Preparation • Fieldwork • Follow-up activities • Report writing
Preparation • Learning objectives • Advance planning • Safety
Quantitative Study
Syllabus 1.5.3 • Quantitative Study of plants and animals of a sample area of the selected ecosystem • Transfer Results to • Diagrams • Graphs • Tables • Histograms • Other relevantmode
Quantitative Study • No. of organisms present • Quadrat
Quadrat • A frame that forms a known area • Usually square shaped • Can be used to measure: Frequency % Cover
Frequency • The chance of finding a named organism within the sample area in a number of quadrats • May be expressed as a percent of the total number of quadrats sampled
Frequency Procedure • Throw the quadrat randomly in the sample area • Record the presence or absence of a named organism within each quadrat • Repeat for a number of throws • Tabulate results
Frequency table If percentage is required multiply frequency by 100
Frequency Procedure • Throw the quadrat randomly in the sample area • Record the presence or absence of a named organism within each quadrat • Repeat for a number of throws • Tabulate results
Plot Graph X axis = Organisms Y axis = % Frequency
Tabulation of results Auto Calculations
% Cover • Quadrat divided into a grid • Intersections form sampling points • Plant scores a hit if touched by the needle • Canopy organisms / all organisms
% Cover • An area of ground occupied by aerial parts of individual plants of the species examined and counted • Expressed as a percentage of the total quadrat area
% Cover procedure • Throw a quadrat at random • Record the plant hit at each sampling point • Repeat for a number of throws • Tabulate results
% Cover procedure • Throw a quadrat at random • Record the plant hit at each sampling point • Repeat for a number of throws • Tabulate results
Tabulation of results Auto Calculations
Data Presentation ICT contributes to display, calculation and analysis of data. (example Excel) Graphs Analysis Calculations Spreadsheets
1.5.7 AnalysisPrepare a brief report of the results obtained Syllabus page 14
Report writing • Option A • Presentation of results and analysis of all ecology fieldwork together in portfolio format • Option B • Presentation of results of each individual ecology activity separately in regular practical notebook with one common analysis
Option AA portfolio should contain • Title page • Introduction • Site description • Methods used • Results • Analysis
Presentation of results of each individual ecology activity separately in regular practical notebook with one common analysis Option B